OUSTOUSTTechnology · Electronic Components

OUST Stock Forecast: Ouster, Inc. Price Predictions for 2026-2027

Last close, 9 Sept 2026
$36
−3.33% on the day

The 6 Wall Street analysts covering Ouster, Inc. hold a median 12-month price target of $57 — +57.3% from the last close. Ticker Nerd's systematic factor model, run across ~4,600 US stocks, ranks it 43 of 100 as at 8 Sept 2026 — in the lower half.

Market cap
$2.7B
Ticker Nerd rank
43 / 100
Median analyst target
$57
Analysts covering
6
Revenue$54.6M+55.9% y/y
Operating income−$20.0M
Net income−$18.1M
Free cash flow−$15.4M
Quarterly, 8 quarters to 30 June 2026 · latest quarter's figure shown
Total return, dividends reinvested
1W
+9.0%
1M
−16.5%
YTD
+67.5%
1Y
+27.1%
From 52W high
−42.0%
From 52W low
+117.9%
$17
$63
52-week range, adjusted closes · the dot is the last close
Ticker Nerd rank

OUST stock analysis: one number for the whole business

Consensus tells you what everyone already believes. The model scores Ouster, Inc. on its factor families — the same systematic rank behind the Ticker Nerd portfolio.

Where the model ranks itAs at 8 Sept 2026
43 / 100

Percentile across ~4,600 US stocks on Ticker Nerd’s systematic factor model. Higher is better. How the model is built and tested

Growth
85
Revisions
81
Momentum
77
Quality
50
Issuance
41
Size
32
Accruals
20
Value
13
Volatility
6

Growth (85): Sales and profits are climbing, and climbing faster than before.

Volatility (6): The share price moves around a lot.

Built and run by Aslam Ghouse, an ex-Goldman Sachs quant trader with fourteen years in markets.

Wall Street

OUST stock forecast 2026-2027: analyst price targets & predictions

The bullish and bearish analyst opinions on OUST, reported as data — targets and ratings, the market's view beside the model's.

Share price and the analyst range, 12 monthsAdjusted close, US dollars
$10$20$30$40$50$60$70$80Oct 25Jan 26Apr 26Jul 26OUSTHigh $75Median $57Low $52

Price targets and ratings are third-party analyst estimates, reported here as data. They are not Ticker Nerd forecasts, and they are frequently wrong.

Data provided by Twelve Data

What Wall Street says6 analysts
5 Buy1 Hold0 Sell
Low $52Median $57High $75

The green dot is the last close — the median target sits +57.3% from it.

Recent analyst actionsNewest first

Of the 20 most recent actions, 3 moved their price target up and 0 moved it down.

DateFirmActionRatingTarget
27 Aug 2026RosenblattMaintainsBuy$53
7 Aug 2026RosenblattMaintainsBuy$53
7 Aug 2026RosenblattMaintainsBuy
21 July 2026Northland Capital MarketsMaintainsOutperform$38$60
21 July 2026Northland Capital MarketsMaintainsOutperform
15 July 2026OppenheimerMaintainsOutperform$42$57
15 July 2026OppenheimerMaintainsOutperform
27 May 2026RosenblattMaintainsBuy
27 May 2026RosenblattMaintainsBuy$40$53
11 May 2026AmerxInitiatesBuy
7 May 2026Cantor FitzgeraldDowngradeNeutral
3 Mar 2026RosenblattMaintainsBuy
7 Nov 2025Cantor FitzgeraldUpgradeOverweight
6 Nov 2025Cantor FitzgeraldUpgradeOverweight
5 Nov 2025RosenblattMaintainsBuy
5 Nov 2025WestPark CapitalReiteratesBuy
13 Aug 2025WestPark CapitalUpgradeBuy
16 July 2025OppenheimerMaintainsOutperform
12 June 2025WestPark CapitalDowngradeHold
9 May 2025WestPark CapitalUpgradeBuy

Price targets and ratings are third-party analyst estimates, reported here as data. They are not Ticker Nerd forecasts, and they are frequently wrong.

Market Radar

This page is one stock. Monday covers all of them.

Computed off the Friday close and sent before the US open.

Market Radar reports the week’s largest rank changes across roughly 4,600 US stocks, the factor behind each one, and where the market went. OUST appears on the weeks it earns a place.

Free, every Monday. Unsubscribe any time.

Performance

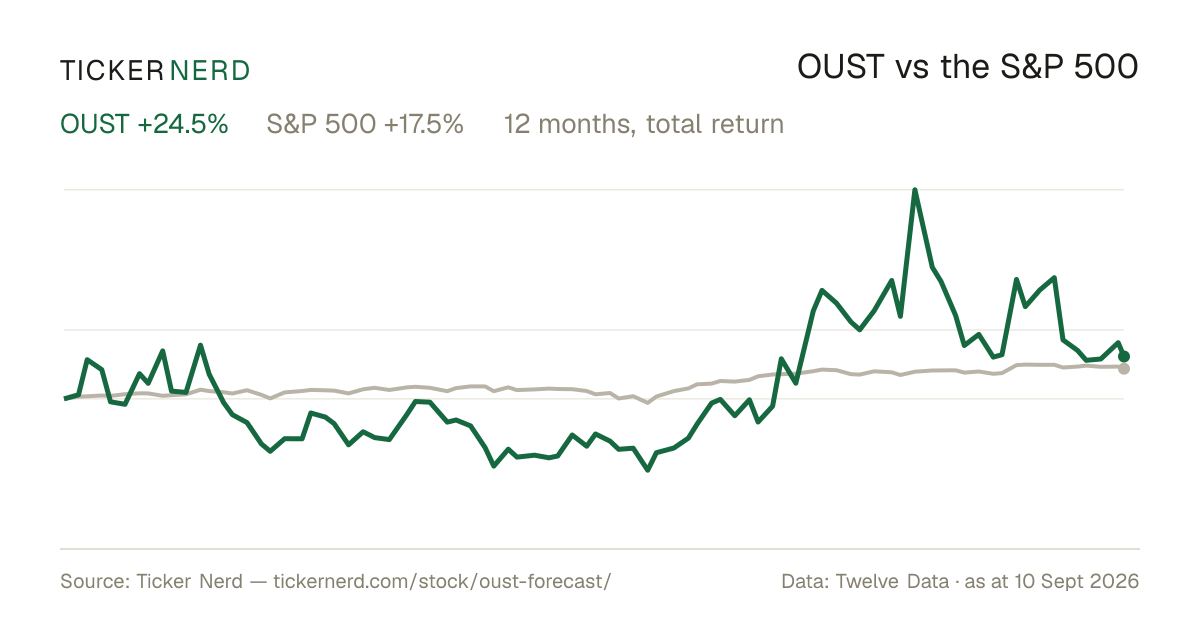
OUST vs the S&P 500

Both lines are total return — dividends reinvested — so the comparison is honest on both sides.

Over the twelve months to 9 Sept 2026, Ouster, Inc. returned +27.1% against +18.5% for the S&P 500, dividends included.

OUST vs S&P 500, last 12 monthsTotal return, rebased to 100
6080100120140160180Oct 25Jan 26Apr 26Jul 26OUSTS&P 500

Download this chart as an image — free to reuse; link this page as the source.

Data provided by Twelve Data

Estimates

OUST analyst estimate revisions

Not the forecast itself — the direction analysts are revising it. Revision direction is one of the model's factor families.

Which way the estimates are movingNext fiscal year
Analysts raising
2
Analysts cutting
1
Fundamentals

Ouster, Inc. (OUST) financial data

A margin means little on its own. Each bar marks where the figure sits across the whole US universe we score.

Valuation
Trailing P/E
−35.0×

Cheaper than 97% of US stocks

Price / sales
13.2×

Cheaper than 12% of US stocks

Price / book
6.9×

Cheaper than 15% of US stocks

EV / EBITDA
−42.2×

Cheaper than 93% of US stocks

Growth & margins
Revenue growth (YoY)
55.9%

Higher than 88% of US stocks

Earnings growth (YoY)
55.9%

Higher than 76% of US stocks

Gross margin
48.9%

Higher than 61% of US stocks

Operating margin
−46.6%

Higher than 17% of US stocks

Net margin
−26.0%

Higher than 14% of US stocks

Returns & dividend
Return on equity
−18.0%

Higher than 32% of US stocks

Return on assets
−10.7%

Higher than 26% of US stocks

Dividend yield

Bars mark the percentile across the ~4,600 US stocks Ticker Nerd covers, among those reporting the figure.

Key statistics

Ouster, Inc. (OUST) statistics: revenue, profit & scale

The headline figures, each with its date. Every row carries its own link — cite it straight from here.

  • Ouster, Inc. has a market value of $2.7B and an enterprise value of $2.5B.

  • Revenue in the twelve months to 30 June 2026: $204.9M. The latest quarter grew 55.9% year on year.

  • Net income over the same four quarters: −$53.3M, a −26.0% net margin.

  • Diluted earnings per share, trailing twelve months: $−0.86.

  • Free cash flow in the twelve months to 30 June 2026: −$82.5M.

  • Shares outstanding: 68.5M.

  • Trailing P/E: −35.0×; forward P/E: −299.9× — the forward figure prices analyst consensus estimates, not reported earnings.

  • Ouster, Inc. employs 320 people $640K of revenue per employee.

Statement figures: company filings via Twelve Data, four quarters to 30 June 2026 · market figures as at 9 Sept 2026

Data provided by Twelve Data

Peers

OUST vs competitors

The nearest names by industry and size, scored by the same model — like for like.

Its peer group, ranked by the same modelElectronic Components
CompanyMarket capTKN rank
OUSTOuster, Inc.$2.7B
43
BHEBenchmark Electronics, Inc.$2.7B
98
KNKnowles Corp.$3.0B
96
ROGRogers Corp.$2.3B
95
OSISOSI Systems, Inc.$3.4B
50
BELFBBel Fuse, Inc.$3.5B
89
OLEDUniversal Display Corp.$3.9B
42

Look up any of the roughly 4,600 stocks we score.

The rank is the raw material. Whether the rules would actually own Ouster, Inc. — and when they’d sell — is the membership. See the Ticker Nerd 20 →

News

Latest OUST news & analysis

Ouster Is Up 70% YTD: Time to Buy More, Hold or Book Profits?

Zacks Investment Research · 9 Sept 2026negative

Ouster has rallied 70% year-to-date, driven by growth in its Rev8 product, Physical AI, and StereoLabs. However, the article notes that the stock's rich valuation and persistent losses support booking profits rather than buying more.

Why it matters — OUST watchers would care because the article weighs the company's growth catalysts against valuation and profitability concerns, signaling a cautionary view on the stock's upside.

Flyability and Ouster Showcase Proven Lidar Partnership at INTERGEO 2026 to Elevate Next-Gen Industrial Inspection

Business Wire · 9 Sept 2026positive

Ouster and Flyability announced they will showcase their long-standing technology collaboration at INTERGEO 2026, scheduled for September 15-17 in Munich, Germany. Flyability will join Ouster at its booth to demonstrate how Flyability's collision-tolerant Elios 3 drone combines with Ouster's sensing technology for industrial inspection.

Why it matters — The partnership demonstration highlights how Ouster's sensors are integrated into real-world, next-generation industrial inspection applications, underscoring its role in physical AI sensing.

Ouster: The Story Is Better Than The Numbers, Sell

Seeking Alpha · 8 Sept 2026negative

Seeking Alpha assigned a Sell rating to Ouster, citing an extended timeline to profitability and an overoptimistic valuation driven by narrative rather than financials. The report notes Ouster is unlikely to be meaningfully earnings-positive until 2028, with EBITDA margins not expected to exceed 18% before 2029, and highlights risks from niche industrial LiDAR reliance and pricing pressure.

Why it matters — A Sell rating from Seeking Alpha signals concern about OUST's delayed path to profitability, valuation, and scaling risks, which Ouster watchers would weigh against their own expectations.

Ouster: Waiting For Physical AI Liftoff

Seeking Alpha · 7 Sept 2026positive

Ouster reported record Q2 revenues of $55M with sensor shipments doubling in two quarters, and Q3 guidance points to continued momentum. The article positions the LiDAR company for growth as Physical AI adoption accelerates, citing recent multi-industry deals and a robust pipeline.

Why it matters — A OUST watcher would care because the company's record revenue, accelerating shipments, and expanding deal pipeline signal strengthening demand for its LiDAR technology in the Physical AI market.

FAQ

Frequently asked questions about OUST stock

What is the OUST stock price forecast for 2026-2027?

The 6 Wall Street analysts covering Ouster, Inc. have a median 12-month price target of $57, with estimates ranging from $52 to $75. These are third-party analyst estimates, not Ticker Nerd forecasts, and they are frequently wrong.

Is OUST stock a buy right now?

Of the 6 analysts covering Ouster, Inc., 5 rate it a Buy, 1 a Hold and 0 a Sell. Ticker Nerd's systematic factor model ranks Ouster, Inc. 43 out of 100 across roughly 4,600 US stocks as at 8 Sept 2026. None of this is personal advice — it does not consider your circumstances.

How does Ticker Nerd's model rank OUST?

As at 8 Sept 2026, Ouster, Inc. ranks 43 out of 100 on Ticker Nerd's systematic factor model — a percentile across roughly 4,600 US stocks, built from its factor families. Its strongest factor family is Growth (85 of 100).

Will OUST stock go up?

No one can know that. What the data says: the median 12-month target from 6 analysts implies +57.3% from the last close, and Ticker Nerd's factor model ranks Ouster, Inc. 43 out of 100 as at 8 Sept 2026. Analyst targets are third-party estimates and frequently wrong; none of this is personal advice.

What is the OUST stock forecast for 2030?

No analyst covering Ouster, Inc. publishes a 2030 price target — Wall Street targets run 12 to 18 months out. Sites quoting a 2030 price for OUST are extrapolating price history, which says nothing about the business. The furthest attributed numbers are the current analyst targets: $52 to $75 over the next 12 months.

How has OUST stock performed over the past year?

Ouster, Inc. returned +27.1% over the 12 months to 9 Sept 2026, with dividends reinvested. Past performance does not indicate future returns.

What does Ouster, Inc. do?

Ouster Inc. is a lidar technology company that develops high-resolution digital sensors and perception software for machine vision and spatial awareness.

What is the latest news on OUST?

The most recent item we track (Zacks Investment Research, 9 Sept 2026): "Ouster, Inc. (OUST) Falls More Steeply Than Broader Market: What Investors Need to Know". Ouster, Inc. (OUST) closed at $36.24 in the latest trading session, down 3.33% from the previous day, a steeper decline than the broader market.

Company

About Ouster, Inc.

Ouster Inc. is a lidar technology company that develops high-resolution digital sensors and perception software for machine vision and spatial awareness. Ouster Inc. serves automotive, industrial, robotics, smart infrastructure, defense, and security markets with products designed to help vehicles, robots, machinery, and fixed assets understand their surroundings in three dimensions. Its portfolio includes short-, mid-, and long-range lidar sensors, surround-view systems, and software platforms that support mapping, traffic analysis, and autonomy-related applications. The company also offers complementary sensing solutions such as cameras, AI compute, and sensor fusion tools, positioning it as a provider of integrated perception systems for physical environments. Headquartered in San Francisco, Ouster Inc. focuses on delivering lidar-based solutions that are used across automation, safety, and infrastructure monitoring use cases.

CEO Mr. Charles Angus Pacala · 320 employees · United States · https://ouster.com