PAYOPAYOTechnology · Software - Infrastructure

PAYO Stock Forecast: Payoneer Global, Inc. Price Predictions for 2026-2027

Last close, 4 Sept 2026
$7.17
−0.14% on the day

The 8 Wall Street analysts covering Payoneer Global, Inc. hold a median 12-month price target of $7.4 — +3.2% from the last close. Ticker Nerd's systematic factor model, run across ~4,600 US stocks, ranks it 44 of 100 as at 5 Sept 2026 — in the lower half.

Market cap
$2.4B
Ticker Nerd rank
44 / 100
Median analyst target
$7.40
Analysts covering
8
Revenue$222.2M+9.8% y/y
Operating income−$35.2M
Net income−$2.4M
Free cash flow$34.1M
Quarterly, 8 quarters to 30 June 2026 · latest quarter's figure shown
Total return, dividends reinvested
1W
+0.8%
1M
+0.6%
YTD
+27.6%
1Y
+7.0%
From 52W high
−0.1%
From 52W low
+67.9%
$4.27
$7.18
52-week range, adjusted closes · the dot is the last close
Ticker Nerd rank

PAYO stock analysis: one number for the whole business

Consensus tells you what everyone already believes. The model scores Payoneer Global, Inc. on its factor families — the same systematic rank behind the Ticker Nerd portfolio.

Where the model ranks itAs at 5 Sept 2026
44 / 100

Percentile across ~4,600 US stocks on Ticker Nerd’s systematic factor model. Higher is better. How the model is built and tested

Issuance
76
Momentum
68
Volatility
67
Quality
51
Value
50
Growth
47
Revisions
45
Size
34
Accruals
23

Issuance (76): The share count has been shrinking and the company is not leaning on new borrowing.

Accruals (23): A large share of reported profit has not shown up as cash, or the balance sheet is expanding quickly — both tend to unwind.

Built and run by Aslam Ghouse, an ex-Goldman Sachs quant trader with fourteen years in markets.

Wall Street

PAYO stock forecast 2026-2027: analyst price targets & predictions

The bullish and bearish analyst opinions on PAYO, reported as data — targets and ratings, the market's view beside the model's.

Share price and the analyst range, 12 monthsAdjusted close, US dollars
$4.00$5.00$6.00$7.00$8.00Oct 25Jan 26Apr 26Jul 26PAYOHigh $7.40Median $7.40Low $7.40

Price targets and ratings are third-party analyst estimates, reported here as data. They are not Ticker Nerd forecasts, and they are frequently wrong.

Data provided by Twelve Data

What Wall Street says8 analysts
1 Buy7 Hold0 Sell
Low $7.40Median $7.40High $7.40

The green dot is the last close — the median target sits +3.2% from it.

Recent analyst actionsNewest first
DateFirmActionRatingTarget
18 June 2026BenchmarkDowngradeHold
16 June 2026CitigroupDowngradeNeutral$10$7.40
15 June 2026NeedhamDowngradeHold
15 June 2026William BlairDowngradeMarket Perform
10 June 2026BenchmarkReiteratesBuy
25 Mar 2026B of A SecuritiesInitiatesBuy
6 Mar 2026BenchmarkMaintainsBuy
27 Feb 2026Keefe, Bruyette & WoodsMaintainsOutperform
26 Feb 2026NeedhamMaintainsBuy
23 Dec 2025BenchmarkMaintainsBuy
6 Nov 2025Goldman SachsMaintainsBuy
6 Oct 2025NeedhamReiteratesBuy
6 Aug 2025NeedhamMaintainsBuy
17 July 2025Deutsche BankReinstatesBuy$8.00
27 May 2025JefferiesMaintainsBuy
22 May 2025CitigroupMaintainsBuy
13 May 2025Keefe, Bruyette & WoodsUpgradeOutperform
8 May 2025Keefe, Bruyette & WoodsMaintainsMarket Perform
8 May 2025NeedhamMaintainsBuy
2 Apr 2025Goldman SachsMaintainsBuy

Price targets and ratings are third-party analyst estimates, reported here as data. They are not Ticker Nerd forecasts, and they are frequently wrong.

Market Radar

This page is one stock. Monday covers all of them.

Computed off the Friday close and sent before the US open.

Market Radar reports the week’s largest rank changes across roughly 4,600 US stocks, the factor behind each one, and where the market went. PAYO appears on the weeks it earns a place.

Free, every Monday. Unsubscribe any time.

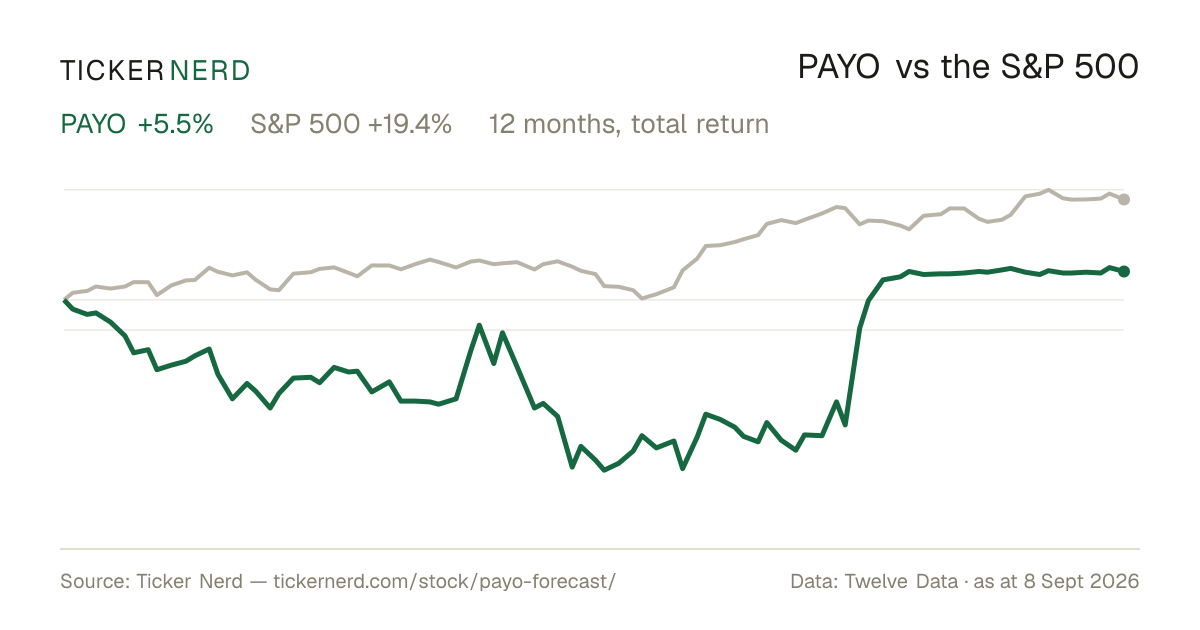
Performance

PAYO vs the S&P 500

Both lines are total return — dividends reinvested — so the comparison is honest on both sides.

Over the twelve months to 4 Sept 2026, Payoneer Global, Inc. returned +7.0% against +20.0% for the S&P 500, dividends included.

PAYO vs S&P 500, last 12 monthsTotal return, rebased to 100
60708090100110120Oct 25Jan 26Apr 26Jul 26PAYOS&P 500

Download this chart as an image — free to reuse; link this page as the source.

Data provided by Twelve Data

Estimates

PAYO analyst estimate revisions

Not the forecast itself — the direction analysts are revising it. Revision direction is one of the model's factor families.

Which way the estimates are movingNext fiscal year
EPS revision, 90 days
+15.6%
Analysts raising
0
Analysts cutting
0
Fundamentals

Payoneer Global, Inc. (PAYO) financial data

A margin means little on its own. Each bar marks where the figure sits across the whole US universe we score.

Valuation
Trailing P/E
51.2×

Cheaper than 14% of US stocks

Price / sales
2.2×

Cheaper than 50% of US stocks

Price / book
3.7×

Cheaper than 28% of US stocks

EV / EBITDA
11.1×

Cheaper than 35% of US stocks

Growth & margins
Revenue growth (YoY)
5.2%

Higher than 39% of US stocks

Earnings growth (YoY)
−4.9%

Higher than 30% of US stocks

Gross margin
Operating margin
6.2%

Higher than 58% of US stocks

Net margin
4.6%

Higher than 59% of US stocks

Returns & dividend
Return on equity
7.1%

Higher than 57% of US stocks

Return on assets
0.9%

Higher than 49% of US stocks

Dividend yield

Bars mark the percentile across the ~4,600 US stocks Ticker Nerd covers, among those reporting the figure.

Key statistics

Payoneer Global, Inc. (PAYO) statistics: revenue, profit & scale

The headline figures, each with its date. Every row carries its own link — cite it straight from here.

  • Payoneer Global, Inc. has a market value of $2.4B and an enterprise value of $2.2B.

  • Revenue in the twelve months to 30 June 2026: $862.4M. The latest quarter grew 5.2% year on year.

  • Net income over the same four quarters: $50.3M, a 5.8% net margin.

  • Free cash flow in the twelve months to 30 June 2026: $115.8M, after $65.6M of capital spending.

  • Payoneer Global, Inc. spent $216.5M on share buybacks in the twelve months to 30 June 2026.

  • Shares outstanding: 338.7M.

  • Trailing P/E: 51.2×; forward P/E: 15.6× — the forward figure prices analyst consensus estimates, not reported earnings.

  • Payoneer Global, Inc. employs 2,540 people $340K of revenue per employee.

Statement figures: company filings via Twelve Data, four quarters to 30 June 2026 · market figures as at 8 Sept 2026

Data provided by Twelve Data

Peers

PAYO vs competitors

The nearest names by industry and size, scored by the same model — like for like.

Its peer group, ranked by the same modelSoftware - Infrastructure
CompanyMarket capTKN rank
PAYOPayoneer Global, Inc.$2.4B
44
STNEStoneCo Ltd.$2.5B
54
RAMPLiveRamp Holdings, Inc.$2.3B
99
CALXCalix, Inc.$2.3B
77
FIVNFive9, Inc.$2.5B
84
FLYWFlywire Corp.$2.3B
85
NNNextNav, Inc.$2.6B
31

Look up any of the roughly 4,600 stocks we score.

The rank is the raw material. Whether the rules would actually own Payoneer Global, Inc. — and when they’d sell — is the membership. See the Ticker Nerd 20 →

News

Latest PAYO news & analysis

Payoneer Global Investor Alert: Kahn Swick & Foti, LLC Investigates Adequacy of Price and Process in Proposed Sale of Payoneer Global Inc. - PAYO

Business Wire · 17 Aug 2026negative

Kahn Swick & Foti, LLC, led by former Louisiana Attorney General Charles C. Foti Jr., is investigating the proposed sale of Payoneer Global Inc. to Nuvei, under which Payoneer shareholders would receive $7.40 in cash per share. The firm is examining whether the consideration and the process leading to it are adequate.

Why it matters — A PAYO watcher would care because the investigation raises questions about the fairness of the proposed $7.40-per-share acquisition price and the process behind the sale to Nuvei.

Payoneer Global Inc. (PAYO) Misses Q2 Earnings Estimates

Zacks Investment Research · 6 Aug 2026negative

Payoneer Global Inc. reported second-quarter earnings of $0.02 per share, below the Zacks Consensus Estimate of $0.05 per share and down from $0.05 per share a year ago.

Why it matters — The earnings shortfall signals that Payoneer's results came in below analysts' expectations for the quarter.

Payoneer Reports Second Quarter 2026 Financial Results

PRNewsWire · 6 Aug 2026positive

Payoneer reported its second-quarter 2026 financial results, showing a 10% increase in revenue excluding interest and 15% volume growth, led by B2B acceleration up 48% year-over-year. The company also noted an agreement announced on June 15, 2026 to be acquired by Nuvei.

Why it matters — Payoneer watchers would care because the results show continued revenue and volume growth alongside a pending acquisition by Nuvei.

FAQ

Frequently asked questions about PAYO stock

What is the PAYO stock price forecast for 2026-2027?

The 8 Wall Street analysts covering Payoneer Global, Inc. have a median 12-month price target of $7.4, with estimates ranging from $7.4 to $7.4. These are third-party analyst estimates, not Ticker Nerd forecasts, and they are frequently wrong.

Is PAYO stock a buy right now?

Of the 8 analysts covering Payoneer Global, Inc., 1 rate it a Buy, 7 a Hold and 0 a Sell. Ticker Nerd's systematic factor model ranks Payoneer Global, Inc. 44 out of 100 across roughly 4,600 US stocks as at 5 Sept 2026. None of this is personal advice — it does not consider your circumstances.

How does Ticker Nerd's model rank PAYO?

As at 5 Sept 2026, Payoneer Global, Inc. ranks 44 out of 100 on Ticker Nerd's systematic factor model — a percentile across roughly 4,600 US stocks, built from its factor families. Its strongest factor family is Issuance (76 of 100).

Will PAYO stock go up?

No one can know that. What the data says: the median 12-month target from 8 analysts implies +3.2% from the last close, and Ticker Nerd's factor model ranks Payoneer Global, Inc. 44 out of 100 as at 5 Sept 2026. Analyst targets are third-party estimates and frequently wrong; none of this is personal advice.

What is the PAYO stock forecast for 2030?

No analyst covering Payoneer Global, Inc. publishes a 2030 price target — Wall Street targets run 12 to 18 months out. Sites quoting a 2030 price for PAYO are extrapolating price history, which says nothing about the business. The furthest attributed numbers are the current analyst targets: $7.4 to $7.4 over the next 12 months.

How has PAYO stock performed over the past year?

Payoneer Global, Inc. returned +7.0% over the 12 months to 4 Sept 2026, with dividends reinvested. Past performance does not indicate future returns.

What does Payoneer Global, Inc. do?

Payoneer Global Inc. is a financial technology company that provides cross-border payment solutions for small and medium-sized businesses, marketplaces, freelancers, and digital merchants.

What is the latest news on PAYO?

The most recent item we track (Business Wire, 17 Aug 2026): "Payoneer Global Investor Alert: Kahn Swick & Foti, LLC Investigates Adequacy of Price and Process in Proposed Sale of Payoneer Global Inc. - PAYO". Kahn Swick & Foti, LLC, led by former Louisiana Attorney General Charles C. Foti Jr., is investigating the proposed sale of Payoneer Global Inc. to Nuvei, under which Payoneer shareholders would receive $7.40 in cash per share. The firm is examining whether the consideration and the process leading to it are adequate.

Company

About Payoneer Global, Inc.

Payoneer Global Inc. is a financial technology company that provides cross-border payment solutions for small and medium-sized businesses, marketplaces, freelancers, and digital merchants. Payoneer Global Inc. offers multi-currency accounts, cross-border accounts receivable and accounts payable tools, funds management, working capital, workforce payments, and other payment services designed to simplify international commerce. Its platform supports businesses that need to send, receive, and manage money across countries and currencies with minimal integration and back-office support. The company serves customers in more than 190 countries and territories, making it an important infrastructure provider in global digital trade and business payments. Payoneer Global Inc. focuses on practical financial operations for globally active businesses rather than consumer banking, helping users handle payments, collections, and operational cash flow through a single platform.

CEO Mr. John R. Caplan · 2,540 employees · United States · https://www.payoneer.com