SEBSEBIndustrials · Conglomerates

SEB Stock Forecast: Seaboard Corp. Price Predictions for 2026-2027

Last close, 21 Aug 2026
$4,260
−2.21% on the day

Ticker Nerd's systematic factor model, run across ~4,600 US stocks, ranks it 57 of 100 as at 22 Aug 2026 — in the upper half.

Market cap
$4.1B
Ticker Nerd rank
57 / 100
Median analyst target
Analysts covering
0
Total return, dividends reinvested
1W
−2.4%
1M
−5.8%
YTD
−4.0%
1Y
+18.2%
From 52W high
−28.4%
From 52W low
+32.7%
$3,211
$5,953
52-week range, adjusted closes · the dot is the last close
Ticker Nerd rank

SEB stock analysis: one number for the whole business

Consensus tells you what everyone already believes. The model scores Seaboard Corp. on its factor families — the same systematic rank behind the Ticker Nerd portfolio.

Where the model ranks itAs at 22 Aug 2026
57 / 100

Percentile across ~4,600 US stocks on Ticker Nerd’s systematic factor model. Higher is better. How the model is built and tested

Growth
88
Quality
83
Volatility
75
Momentum
73
Issuance
68
Value
55
Size
27
Revisions
25
Accruals
22

Growth (88): Sales and profits are climbing, and climbing faster than before.

Accruals (22): A large share of reported profit has not shown up as cash, or the balance sheet is expanding quickly — both tend to unwind.

Built and run by Aslam Ghouse, an ex-Goldman Sachs quant trader with fourteen years in markets.

Wall Street

SEB stock forecast 2026-2027: analyst price targets & predictions

The bullish and bearish analyst opinions on SEB, reported as data — targets and ratings, the market's view beside the model's.

Share price and the analyst range, 12 monthsAdjusted close, US dollars
$3,000$3,500$4,000$4,500$5,000$5,500$6,000$6,500Oct 25Jan 26Apr 26Jul 26SEB

Price targets and ratings are third-party analyst estimates, reported here as data. They are not Ticker Nerd forecasts, and they are frequently wrong.

Price targets and ratings are third-party analyst estimates, reported here as data. They are not Ticker Nerd forecasts, and they are frequently wrong.

Market Radar

This page is one stock. Monday covers all of them.

Computed off the Friday close and sent before the US open.

Market Radar reports the week’s largest rank changes across roughly 4,600 US stocks, the factor behind each one, and where the market went. SEB appears on the weeks it earns a place.

Free, every Monday. Unsubscribe any time.

Estimates

SEB analyst estimate revisions

Not the forecast itself — the direction analysts are revising it. Revision direction is one of the model's factor families.

Fundamentals

Seaboard Corp. (SEB) financial data

A margin means little on its own. Each bar marks where the figure sits across the whole US universe we score.

Valuation
Trailing P/E
6.5×

Cheaper than 65% of US stocks

Price / sales
0.4×

Cheaper than 86% of US stocks

Price / book
0.7×

Cheaper than 81% of US stocks

EV / EBITDA
7.3×

Cheaper than 48% of US stocks

Growth & margins
Revenue growth (YoY)
17.8%

Higher than 67% of US stocks

Earnings growth (YoY)
50.0%

Higher than 75% of US stocks

Gross margin
7.6%

Higher than 8% of US stocks

Operating margin
3.4%

Higher than 51% of US stocks

Net margin
6.2%

Higher than 63% of US stocks

Returns & dividend
Return on equity
12.3%

Higher than 69% of US stocks

Return on assets
2.6%

Higher than 63% of US stocks

Dividend yield
0.2%

Higher than 4% of US dividend payers

Bars mark the percentile across the ~4,600 US stocks Ticker Nerd covers, among those reporting the figure.

Peers

SEB vs competitors

The nearest names by industry and size, scored by the same model — like for like.

Its peer group, ranked by the same modelConglomerates
CompanyMarket capTKN rank
SEBSeaboard Corp.$4.1B
57
OTTROtter Tail Corp.$3.8B
57
GHCGraham Holdings Co.$5.1B
47
VMIValmont Industries, Inc.$9.6B
83
FBYDFalcon’s Beyond Global, Inc.$1.3B
27
DLXDeluxe Corp.$1.1B
98
TTITETRA Technologies, Inc.$1.1B
39

Look up any of the roughly 4,600 stocks we score.

The rank is the raw material. Whether the rules would actually own Seaboard Corp. — and when they’d sell — is the membership. See the Ticker Nerd 20 →

News

Latest SEB news & analysis

SEABOARD CORPORATION REPORT OF EARNINGS AND DIVIDEND DECLARATION

PRNewsWire · 4 Aug 2026neutral

Seaboard Corporation released its earnings report for the three and six months ended July 4, 2026 and June 28, 2025. The company also declared a dividend.

Why it matters — SEB watchers would care because the earnings report and dividend declaration provide a routine update on the company's financial performance and shareholder returns.

FAQ

Frequently asked questions about SEB stock

How does Ticker Nerd's model rank SEB?

As at 22 Aug 2026, Seaboard Corp. ranks 57 out of 100 on Ticker Nerd's systematic factor model — a percentile across roughly 4,600 US stocks, built from its factor families. Its strongest factor family is Growth (88 of 100).

What is the SEB stock forecast for 2030?

No analyst covering Seaboard Corp. publishes a 2030 price target — Wall Street targets run 12 to 18 months out. Sites quoting a 2030 price for SEB are extrapolating price history, which says nothing about the business.

How has SEB stock performed over the past year?

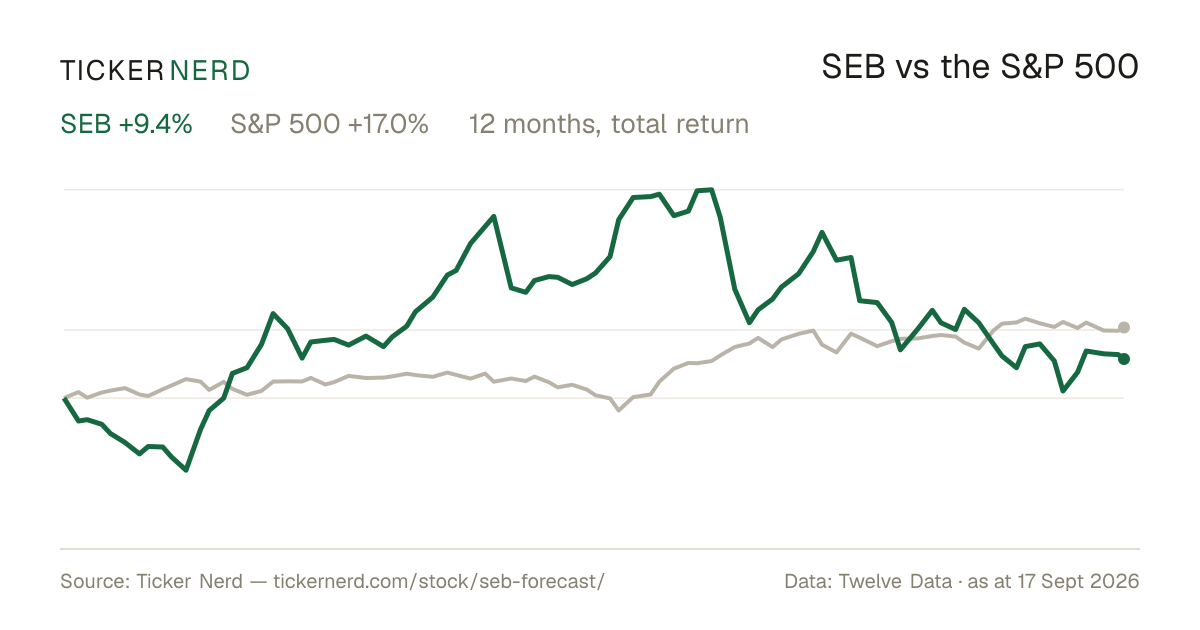
Seaboard Corp. returned +18.2% over the 12 months to 21 Aug 2026, with dividends reinvested. Past performance does not indicate future returns.

What does Seaboard Corp. do?

Seaboard Corporation is a diversified multinational conglomerate engaged primarily in agribusiness and transportation sectors. Its principal function is to operate integrated production systems that horizontally and vertically combine both processing and shipping activities.

What is the latest news on SEB?

The most recent item we track (PRNewsWire, 4 Aug 2026): "SEABOARD CORPORATION REPORT OF EARNINGS AND DIVIDEND DECLARATION". Seaboard Corporation released its earnings report for the three and six months ended July 4, 2026 and June 28, 2025. The company also declared a dividend.

Company

About Seaboard Corp.

Seaboard Corporation is a diversified multinational conglomerate engaged primarily in agribusiness and transportation sectors. Its principal function is to operate integrated production systems that horizontally and vertically combine both processing and shipping activities. This includes pork production, ocean transportation, and commodity merchandising. Seaboard’s agribusiness operations are predominantly in the United States and around the world, where it processes pork products, and mills grains, enhancing its role in food production and distribution. The company’s ocean transportation service is a significant component, offering cargo movement solutions that serve as a bridge between economies, especially in the Caribbean and Latin America. This integration provides a unique advantage in logistics and international trade. Established in 1918 and headquartered in Merriam, Kansas, Seaboard Corporation holds a notable position on the American Stock Exchange with a reputation for its robust operational execution and strategic global presence. Seaboard's diverse business model enables it to mitigate risks while capitalizing on opportunities within the sectors it operates.

CEO Mr. Robert L. Steer · 14,000 employees · United States · https://www.seaboardcorp.com