SST Stock Forecast: System1, Inc. Price Predictions for 2026-2027
Ticker Nerd's systematic factor model, run across ~4,600 US stocks, ranks it 32 of 100 as at 1 Aug 2026 — in the lower half.
SST stock analysis: one number for the whole business
Consensus tells you what everyone already believes. The model scores System1, Inc. on its factor families — the same systematic rank behind the Ticker Nerd portfolio.
Percentile across ~4,600 US stocks on Ticker Nerd’s systematic factor model. Higher is better. How the model is built and tested
Accruals (96): Reported profit is backed by cash, and the company is not expanding recklessly.
Growth (21): Sales and profits are flat, shrinking, or growing more slowly than they were.
The rank is the raw material. Whether the rules would actually own System1, Inc. — and when they’d sell — is the membership.
SST stock forecast 2026-2027: analyst price targets & predictions
The bullish and bearish analyst opinions on SST, reported as data — targets and ratings, the market's view beside the model's.
Price targets and ratings are third-party analyst estimates, reported here as data. They are not Ticker Nerd forecasts, and they are frequently wrong.
| Date | Firm | Action | Rating | Target |
|---|---|---|---|---|
| 8 Aug 2025 | Benchmark | Maintains | Buy | $5.00 → $10 |
| 8 Aug 2025 | Benchmark | Maintains | Buy | — |
| 11 Mar 2025 | Benchmark | Reiterates | Buy | — |
| 19 Mar 2024 | Evercore ISI Group | Maintains | In-Line | — |
| 11 Aug 2023 | Benchmark | Maintains | Buy | — |
| 12 June 2023 | DA Davidson | Maintains | Buy | — |
| 8 Nov 2022 | B of A Securities | Downgrade | Underperform | — |
| 12 Aug 2022 | Benchmark | Maintains | Buy | — |
| 12 Aug 2022 | DA Davidson | Maintains | Buy | — |
| 11 July 2022 | B of A Securities | Initiates | Buy | — |
| 26 Apr 2022 | Evercore ISI Group | Initiates | In-Line | — |
Price targets and ratings are third-party analyst estimates, reported here as data. They are not Ticker Nerd forecasts, and they are frequently wrong.
SST analyst estimate revisions
Not the forecast itself — the direction analysts are revising it. Revision direction is one of the model's factor families.
System1, Inc. (SST) financial data
A margin means little on its own. Each bar marks where the figure sits across the whole US universe we score.
- Trailing P/E
- 54.0×
- Price / sales
- 0.1×
- Price / book
- −0.4×
- EV / EBITDA
- 46.1×
Cheaper than 14% of US stocks
Cheaper than 97% of US stocks
Cheaper than 93% of US stocks
Cheaper than 5% of US stocks
- Revenue growth (YoY)
- −50.0%
- Earnings growth (YoY)
- −50.0%
- Gross margin
- 62.8%
- Operating margin
- −32.3%
- Net margin
- −42.2%
Higher than 5% of US stocks
Higher than 10% of US stocks
Higher than 77% of US stocks
Higher than 20% of US stocks
Higher than 11% of US stocks
- Return on equity
- −830.6%
- Return on assets
- −10.3%
- Dividend yield
- —
Higher than 1% of US stocks
Higher than 26% of US stocks
Bars mark the percentile across the ~4,600 US stocks Ticker Nerd covers, among those reporting the figure.
SST vs competitors
The nearest names by industry and size, scored by the same model — like for like.
This page is one stock. Monday covers all of them.
Computed off the Friday close and sent before the US open.
Market Radar reports the week’s largest rank changes across roughly 4,600 US stocks, the factor behind each one, and where the market went. SST appears on the weeks it earns a place.
Frequently asked questions about SST stock
Is SST stock a buy right now?
Of the 1 analysts covering System1, Inc., 1 rate it a Buy, 0 a Hold and 0 a Sell. Ticker Nerd's systematic factor model ranks System1, Inc. 32 out of 100 across roughly 4,600 US stocks as at 1 Aug 2026. None of this is personal advice — it does not consider your circumstances.
How does Ticker Nerd's model rank SST?
As at 1 Aug 2026, System1, Inc. ranks 32 out of 100 on Ticker Nerd's systematic factor model — a percentile across roughly 4,600 US stocks, built from its factor families. Its strongest factor family is Accruals (96 of 100).
What is the SST stock forecast for 2030?
No analyst covering System1, Inc. publishes a 2030 price target — Wall Street targets run 12 to 18 months out. Sites quoting a 2030 price for SST are extrapolating price history, which says nothing about the business.
How has SST stock performed over the past year?
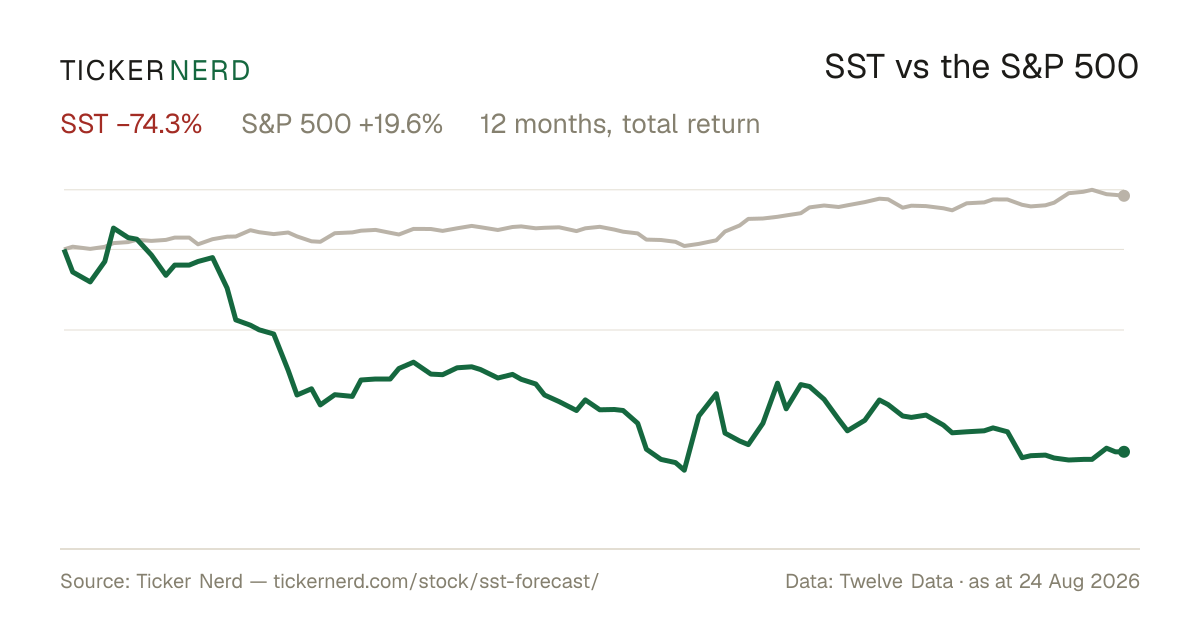
System1, Inc. returned -70.7% over the 12 months to 3 Aug 2026, with dividends reinvested. Past performance does not indicate future returns.
What does System1, Inc. do?
System1 Inc. is a technology and marketing company that operates a proprietary end-to-end customer acquisition and monetization platform.
About System1, Inc.
System1 Inc. is a technology and marketing company that operates a proprietary end-to-end customer acquisition and monetization platform. The company focuses on matching consumer intent with relevant advertising and content across digital channels, using data science and machine learning to optimize user acquisition and advertising yield. System1 Inc. serves advertisers, publishers, and marketers by helping them acquire high-intent customers at scale and improve return on marketing spend through programmatic and performance-based campaigns. In addition to its advertising technology operations, the company provides consumer security and privacy software solutions, including antivirus and related tools that offer protection and monitoring features for end users. These software offerings are typically delivered as packaged solutions aimed at enhancing online safety and privacy for individuals. Headquartered in Los Angeles, California and founded in 2013, System1 Inc. today participates in the broader digital advertising, martech, and consumer security software markets, positioning itself at the intersection of performance marketing and privacy-focused consumer applications.
CEO Mr. Michael L. Blend · 250 employees · United States · https://system1.com