SYMSYMIndustrials · Specialty Industrial Machinery

SYM Stock Forecast: Symbotic, Inc. Price Predictions for 2026-2027

Last close, 3 Aug 2026
$46
+6.50% on the day

The 18 Wall Street analysts covering Symbotic, Inc. hold a median 12-month price target of $70 — +52.7% from the last close. Ticker Nerd's systematic factor model, run across ~4,600 US stocks, ranks it 38 of 100 as at 1 Aug 2026 — in the lower half. The Street sees upside; the factor read is a caution. That gap is the story on this page.

Market cap
$26.0B
Ticker Nerd rank
38 / 100
Median analyst target
$70
Analysts covering
18
Total return, dividends reinvested
1W
+10.5%
1M
+7.3%
YTD
−22.9%
1Y
−9.8%
From 52W high
−47.5%
From 52W low
+18.9%
$39
$87
52-week range, adjusted closes · the dot is the last close
Ticker Nerd rank

SYM stock analysis: one number for the whole business

Consensus tells you what everyone already believes. The model scores Symbotic, Inc. on its factor families — the same systematic rank behind the Ticker Nerd portfolio.

Where the model ranks itAs at 1 Aug 2026
38 / 100

Percentile across ~4,600 US stocks on Ticker Nerd’s systematic factor model. Higher is better. How the model is built and tested

Accruals
82
Revisions
80
Quality
69
Momentum
46
Growth
42
Issuance
40
Value
20
Volatility
9
Size
8

Accruals (82): Reported profit is backed by cash, and the company is not expanding recklessly.

Volatility (9): The share price moves around a lot.

Size (8): Larger than most of the companies we track — more scrutinised, less often mispriced.

The rank is the raw material. Whether the rules would actually own Symbotic, Inc. — and when they’d sell — is the membership.

Wall Street

SYM stock forecast 2026-2027: analyst price targets & predictions

The bullish and bearish analyst opinions on SYM, reported as data — targets and ratings, the market's view beside the model's.

Share price and the analyst range, 12 monthsAdjusted close, US dollars
$40$50$60$70$80$90Oct 25Jan 26Apr 26Jul 26SYMHigh $84Median $70Low $44

Price targets and ratings are third-party analyst estimates, reported here as data. They are not Ticker Nerd forecasts, and they are frequently wrong.

What Wall Street says18 analysts
10 Buy5 Hold3 Sell
Low $44Median $70High $84

The green dot is the last close — the median target sits +52.7% from it.

Recent analyst actionsNewest first
DateFirmActionRatingTarget
26 May 2026Goldman SachsMaintainsSell$54$45
11 May 2026DA DavidsonMaintainsBuy
15 Apr 2026DA DavidsonUpgradeBuy
16 Mar 2026BarclaysMaintainsUnderweight
19 Feb 2026KeybancUpgradeOverweight
9 Feb 2026DA DavidsonMaintainsNeutral
5 Feb 2026NeedhamMaintainsBuy
12 Jan 2026BarclaysMaintainsUnderweight
2 Dec 2025Goldman SachsDowngradeSell
26 Nov 2025BairdMaintainsNeutral
26 Nov 2025BarclaysMaintainsUnderweight
25 Nov 2025Cantor FitzgeraldMaintainsOverweight
25 Nov 2025CitigroupMaintainsBuy
25 Nov 2025Craig-HallumUpgradeBuy
25 Nov 2025DA DavidsonMaintainsNeutral
25 Nov 2025NeedhamMaintainsBuy
25 Nov 2025Northland Capital MarketsMaintainsOutperform
8 Oct 2025BarclaysInitiatesUnderweight
23 Sept 2025UBSDowngradeSell
25 Aug 2025DA DavidsonDowngradeNeutral

Price targets and ratings are third-party analyst estimates, reported here as data. They are not Ticker Nerd forecasts, and they are frequently wrong.

Estimates

SYM analyst estimate revisions

Not the forecast itself — the direction analysts are revising it. Revision direction is one of the model's factor families.

Which way the estimates are movingNext fiscal year
EPS revision, 90 days
+2.8%
Analysts raising
1
Analysts cutting
0
Fundamentals

Symbotic, Inc. (SYM) financial data

A margin means little on its own. Each bar marks where the figure sits across the whole US universe we score.

Valuation
Trailing P/E
−268.9×

Cheaper than 99% of US stocks

Price / sales
10.3×

Cheaper than 14% of US stocks

Price / book
8.0×

Cheaper than 13% of US stocks

EV / EBITDA
169.4×

Cheaper than 1% of US stocks

Growth & margins
Revenue growth (YoY)
23.1%

Higher than 75% of US stocks

Earnings growth (YoY)
23.1%

Higher than 64% of US stocks

Gross margin
22.2%

Higher than 25% of US stocks

Operating margin
1.1%

Higher than 50% of US stocks

Net margin
−0.3%

Higher than 30% of US stocks

Returns & dividend
Return on equity
−5.7%

Higher than 39% of US stocks

Return on assets
−0.6%

Higher than 41% of US stocks

Dividend yield

Bars mark the percentile across the ~4,600 US stocks Ticker Nerd covers, among those reporting the figure.

Peers

SYM vs competitors

The nearest names by industry and size, scored by the same model — like for like.

Its peer group, ranked by the same modelSpecialty Industrial Machinery
CompanyMarket capTKN rank
SYMSymbotic, Inc.$26.0B
38
DOVDover Corp.$27.6B
68
XYLXylem, Inc.$27.8B
53
OTISOtis Worldwide Corp.$28.0B
49
IRIngersoll Rand, Inc.$32.7B
62
INIOINNIO NV$18.3B
0
IEXIDEX Corp.$17.2B
84
Market Radar

This page is one stock. Monday covers all of them.

Computed off the Friday close and sent before the US open.

Market Radar reports the week’s largest rank changes across roughly 4,600 US stocks, the factor behind each one, and where the market went. SYM appears on the weeks it earns a place.

Free, every Monday. Unsubscribe any time.

News

Latest SYM news & analysis

Serve Robotics Surges 13%, Ouster Climbs 6%, Symbotic Gains 4% as Robotics Stocks Rally

24/7 Wall Street · 3 Aug 2026positive

Robotics stocks rallied Monday morning on a broad risk-on tape, with Symbotic gaining 4% alongside peers Serve Robotics (up 13%) and Ouster (up 6%). Traders were also positioning ahead of a key earnings print later this week.

Why it matters — A sector-wide rally in robotics shares highlights the momentum and market attention Symbotic is drawing as the group trades ahead of an upcoming earnings report.

Exploring Analyst Estimates for SYMBOTIC INC (SYM) Q3 Earnings, Beyond Revenue and EPS

Zacks Investment Research · 3 Aug 2026neutral

Zacks Investment Research examines analyst estimates for Symbotic's Q3 earnings for the quarter ended June 2026, going beyond standard revenue and EPS projections to analyze key metrics for deeper insight.

Why it matters — A SYM watcher would benefit from this analysis of the company's expected quarterly performance and key metrics ahead of its earnings report.

Symbotic's CTO Sold Nearly 20,000 Company Shares. Here's What That Means for Investors.

The Motley Fool · 30 July 2026negative

Symbotic's Chief Technology Officer sold 18,987 shares valued at approximately $766,703 based on the July 24, 2026 weighted average price, reducing the insider's direct equity holdings by 8%.

Why it matters — A significant insider sale by a top executive can signal reduced confidence in the company's near-term prospects, making it noteworthy for current and potential shareholders.

Symbotic Gears Up to Report Q3 Earnings: Here's What to Expect

Zacks Investment Research · 30 July 2026neutral

Symbotic is approaching its fiscal third-quarter earnings report with expectations of 20.7% revenue growth and a $22.7 billion backlog, while facing margin pressure from elevated costs.

Why it matters — The report will show whether Symbotic can balance its strong revenue growth and massive order backlog against the margin compression caused by rising costs.

Why Symbotic Inc. (SYM) Dipped More Than Broader Market Today

Zacks Investment Research · 29 July 2026negative

Symbotic Inc. (SYM) shares fell 4.72% in the latest trading session, closing at $40.34 and declining more than the broader market.

Why it matters — The stock's larger-than-market decline may signal company-specific concerns or selling pressure beyond general market trends.

FAQ

Frequently asked questions about SYM stock

What is the SYM stock price forecast for 2026-2027?

The 18 Wall Street analysts covering Symbotic, Inc. have a median 12-month price target of $70, with estimates ranging from $44 to $84. These are third-party analyst estimates, not Ticker Nerd forecasts, and they are frequently wrong.

Is SYM stock a buy right now?

Of the 18 analysts covering Symbotic, Inc., 10 rate it a Buy, 5 a Hold and 3 a Sell. Ticker Nerd's systematic factor model ranks Symbotic, Inc. 38 out of 100 across roughly 4,600 US stocks as at 1 Aug 2026. None of this is personal advice — it does not consider your circumstances.

How does Ticker Nerd's model rank SYM?

As at 1 Aug 2026, Symbotic, Inc. ranks 38 out of 100 on Ticker Nerd's systematic factor model — a percentile across roughly 4,600 US stocks, built from its factor families. Its strongest factor family is Accruals (82 of 100).

Will SYM stock go up?

No one can know that. What the data says: the median 12-month target from 18 analysts implies +52.7% from the last close, and Ticker Nerd's factor model ranks Symbotic, Inc. 38 out of 100 as at 1 Aug 2026. Analyst targets are third-party estimates and frequently wrong; none of this is personal advice.

What is the SYM stock forecast for 2030?

No analyst covering Symbotic, Inc. publishes a 2030 price target — Wall Street targets run 12 to 18 months out. Sites quoting a 2030 price for SYM are extrapolating price history, which says nothing about the business. The furthest attributed numbers are the current analyst targets: $44 to $84 over the next 12 months.

How has SYM stock performed over the past year?

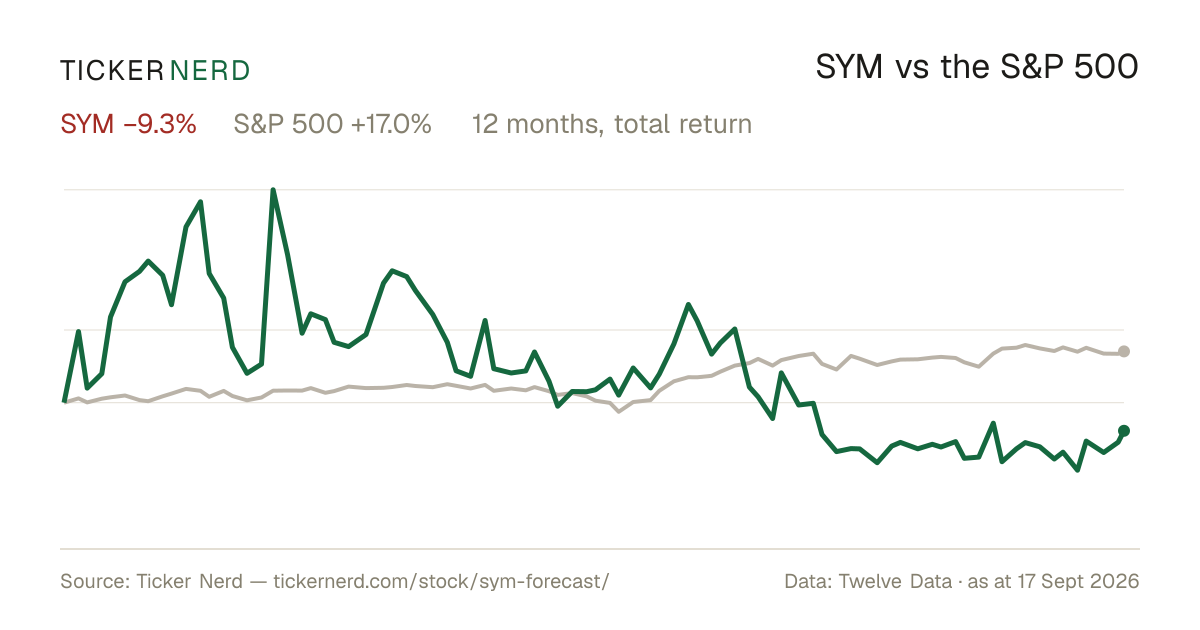
Symbotic, Inc. returned -9.8% over the 12 months to 3 Aug 2026, with dividends reinvested. Past performance does not indicate future returns.

What does Symbotic, Inc. do?

Symbotic Inc. Class A represents equity in an automation technology company that develops and deploys end-to-end, AI-powered robotic and software platforms for warehouse and supply chain operations.

What is the latest news on SYM?

The most recent item we track (24/7 Wall Street, 3 Aug 2026): "Serve Robotics Surges 13%, Ouster Climbs 6%, Symbotic Gains 4% as Robotics Stocks Rally". Robotics stocks rallied Monday morning on a broad risk-on tape, with Symbotic gaining 4% alongside peers Serve Robotics (up 13%) and Ouster (up 6%). Traders were also positioning ahead of a key earnings print later this week.

Company

About Symbotic, Inc.

Symbotic Inc. Class A represents equity in an automation technology company that develops and deploys end-to-end, AI-powered robotic and software platforms for warehouse and supply chain operations. The company focuses on transforming large-scale distribution centers with systems that automate storage, retrieval, case handling, palletizing, and depalletizing to enhance speed, accuracy, and overall efficiency in the flow of goods. Symbotic’s platform combines advanced robotics, high‑density storage, computer vision, and machine learning to manage complex inventory patterns and high-throughput environments for major retail, wholesale, food and beverage, and related distribution customers. Revenue is generated primarily from integrated systems, software maintenance and support, and ongoing operation services, positioning the company as a technology and solutions provider rather than solely an equipment manufacturer. Founded in 2007 and headquartered in Wilmington, Massachusetts, Symbotic Inc. plays a significant role in the modernization of supply chains, helping enterprises convert their warehouses into strategic assets within broader logistics and automation ecosystems.

CEO Mr. Richard B. Cohen · 2,000 employees · United States · https://www.symbotic.com