TTAMTTAMBasic Materials · Building Materials

TTAM Stock Forecast: Titan America SA Price Predictions for 2026-2027

Last close, 3 Aug 2026
$16
+2.39% on the day

The 7 Wall Street analysts covering Titan America SA hold a median 12-month price target of $19 — +16.7% from the last close. Ticker Nerd's systematic factor model, run across ~4,600 US stocks, ranks it 32 of 100 as at 1 Aug 2026 — in the lower half. The Street sees upside; the factor read is a caution. That gap is the story on this page.

Market cap
$2.9B
Ticker Nerd rank
32 / 100
Median analyst target
$19
Analysts covering
7
Total return, dividends reinvested
1W
−9.3%
1M
−13.0%
YTD
−3.4%
1Y
+16.0%
From 52W high
−18.0%
From 52W low
+12.1%
$14
$19
52-week range, adjusted closes · the dot is the last close
Ticker Nerd rank

TTAM stock analysis: one number for the whole business

Consensus tells you what everyone already believes. The model scores Titan America SA on its factor families — the same systematic rank behind the Ticker Nerd portfolio.

Where the model ranks itAs at 1 Aug 2026
32 / 100

Percentile across ~4,600 US stocks on Ticker Nerd’s systematic factor model. Higher is better. How the model is built and tested

Value
67
Revisions
60
Momentum
55
Quality
50
Volatility
42
Accruals
39
Size
31
Growth
27
Issuance
24

Value (67): The shares cost little relative to the profits and assets behind them — which can mean the market is too gloomy, or that the business really is in trouble.

Issuance (24): The company has been issuing shares or taking on financing, diluting existing holders.

The rank is the raw material. Whether the rules would actually own Titan America SA — and when they’d sell — is the membership.

Wall Street

TTAM stock forecast 2026-2027: analyst price targets & predictions

The bullish and bearish analyst opinions on TTAM, reported as data — targets and ratings, the market's view beside the model's.

Share price and the analyst range, 12 monthsAdjusted close, US dollars
$14$16$18$20$22Oct 25Jan 26Apr 26Jul 26TTAMHigh $22Median $19Low $15

Price targets and ratings are third-party analyst estimates, reported here as data. They are not Ticker Nerd forecasts, and they are frequently wrong.

What Wall Street says7 analysts
2 Buy4 Hold1 Sell
Low $15Median $19High $22

The green dot is the last close — the median target sits +16.7% from it.

Recent analyst actionsNewest first
DateFirmActionRatingTarget
29 July 2026StifelMaintainsHold
29 July 2026StifelMaintainsHold$18$19
8 July 2026CitigroupMaintainsBuy$20$22
8 July 2026CitigroupMaintainsBuy
8 May 2026CitigroupMaintainsBuy
19 Mar 2026CitigroupMaintainsBuy
8 Jan 2026CitigroupMaintainsBuy
19 Dec 2025BernsteinMaintainsMarket Perform
15 Dec 2025JefferiesMaintainsBuy
28 July 2025StifelDowngradeHold
24 July 2025B of A SecuritiesDowngradeUnderperform
21 Apr 2025StifelMaintainsBuy
28 Mar 2025Goldman SachsMaintainsNeutral
28 Mar 2025StifelMaintainsBuy
27 Mar 2025B of A SecuritiesMaintainsNeutral
5 Mar 2025JefferiesInitiatesBuy
4 Mar 2025B of A SecuritiesInitiatesNeutral
4 Mar 2025CitigroupInitiatesBuy
4 Mar 2025Goldman SachsInitiatesNeutral
4 Mar 2025StifelInitiatesBuy

Price targets and ratings are third-party analyst estimates, reported here as data. They are not Ticker Nerd forecasts, and they are frequently wrong.

Estimates

TTAM analyst estimate revisions

Not the forecast itself — the direction analysts are revising it. Revision direction is one of the model's factor families.

Which way the estimates are movingNext fiscal year
EPS revision, 90 days
−6.6%
Analysts raising
0
Analysts cutting
1
Fundamentals

Titan America SA (TTAM) financial data

A margin means little on its own. Each bar marks where the figure sits across the whole US universe we score.

Valuation
Trailing P/E
16.5×

Cheaper than 44% of US stocks

Price / sales
1.7×

Cheaper than 57% of US stocks

Price / book
2.7×

Cheaper than 37% of US stocks

EV / EBITDA
9.4×

Cheaper than 41% of US stocks

Growth & margins
Revenue growth (YoY)
9.6%

Higher than 54% of US stocks

Earnings growth (YoY)
−15.4%

Higher than 22% of US stocks

Gross margin
24.0%

Higher than 28% of US stocks

Operating margin
13.3%

Higher than 72% of US stocks

Net margin
10.4%

Higher than 71% of US stocks

Returns & dividend
Return on equity
17.4%

Higher than 79% of US stocks

Return on assets
8.2%

Higher than 89% of US stocks

Dividend yield
1.0%

Higher than 23% of US dividend payers

Bars mark the percentile across the ~4,600 US stocks Ticker Nerd covers, among those reporting the figure.

Peers

TTAM vs competitors

The nearest names by industry and size, scored by the same model — like for like.

Its peer group, ranked by the same modelBuilding Materials
CompanyMarket capTKN rank
TTAMTitan America SA$2.9B
32
USLMUnited States Lime & Minerals, Inc.$3.2B
34
KNFKnife River Corp.$4.2B
26
TGLSTecnoglass Holdings, Inc.$1.9B
25
EXPEagle Materials, Inc.$6.6B
34
RMIXSuncrete, Inc.$1.2B
61
MLMMartin Marietta Materials, Inc.$31.7B
20
Market Radar

This page is one stock. Monday covers all of them.

Computed off the Friday close and sent before the US open.

Market Radar reports the week’s largest rank changes across roughly 4,600 US stocks, the factor behind each one, and where the market went. TTAM appears on the weeks it earns a place.

Free, every Monday. Unsubscribe any time.

News

Latest TTAM news & analysis

TTAM vs. IBP: Which Stock Is the Better Value Option?

Zacks Investment Research · 30 July 2026neutral

Zacks Investment Research published a comparison between Titan America (TTAM) and Installed Building Products (IBP), examining which stock offers more value for investors in the Building Products sector.

Why it matters — TTAM watchers would care because the article positions TTAM against a competitor in the same sector and evaluates it from a value-investing perspective.

Titan America SA (TTAM) Q2 2026 Earnings Call Transcript

Seeking Alpha · 29 July 2026neutral

Seeking Alpha published the transcript of Titan America SA's Q2 2026 earnings call.

Why it matters — TTAM watchers can review management's full Q2 remarks and Q&A for direct insight into the company's recent performance and outlook.

Titan America Q2 Earnings Call Highlights

MarketBeat · 29 July 2026positive

Titan America reported second-quarter 2026 revenue growth and a modest increase in adjusted EBITDA, with strong Mid-Atlantic demand offsetting operational disruptions and softer residential construction conditions in Florida.

Why it matters — The results indicate that Titan America's geographic diversification is helping to cushion regional weaknesses, which is a key factor for investors monitoring the company's earnings stability.

Titan America (TTAM) Q2 Earnings Miss Estimates

Zacks Investment Research · 28 July 2026negative

Titan America (TTAM) reported Q2 earnings of $0.23 per share, below the Zacks Consensus Estimate of $0.29 per share and down from $0.28 per share in the same quarter last year.

Why it matters — The earnings miss signals that TTAM's quarterly performance fell short of analyst expectations and declined compared to the prior year.

Titan America Announces Second Quarter 2026 Results

Business Wire · 28 July 2026neutral

Titan America announced it would release its second quarter 2026 financial results. No additional details about the results were provided in the announcement.

Why it matters — TTAM watchers follow quarterly results to assess the company's financial performance and operational trends.

FAQ

Frequently asked questions about TTAM stock

What is the TTAM stock price forecast for 2026-2027?

The 7 Wall Street analysts covering Titan America SA have a median 12-month price target of $19, with estimates ranging from $15 to $22. These are third-party analyst estimates, not Ticker Nerd forecasts, and they are frequently wrong.

Is TTAM stock a buy right now?

Of the 7 analysts covering Titan America SA, 2 rate it a Buy, 4 a Hold and 1 a Sell. Ticker Nerd's systematic factor model ranks Titan America SA 32 out of 100 across roughly 4,600 US stocks as at 1 Aug 2026. None of this is personal advice — it does not consider your circumstances.

How does Ticker Nerd's model rank TTAM?

As at 1 Aug 2026, Titan America SA ranks 32 out of 100 on Ticker Nerd's systematic factor model — a percentile across roughly 4,600 US stocks, built from its factor families. Its strongest factor family is Value (67 of 100).

Will TTAM stock go up?

No one can know that. What the data says: the median 12-month target from 7 analysts implies +16.7% from the last close, and Ticker Nerd's factor model ranks Titan America SA 32 out of 100 as at 1 Aug 2026. Analyst targets are third-party estimates and frequently wrong; none of this is personal advice.

What is the TTAM stock forecast for 2030?

No analyst covering Titan America SA publishes a 2030 price target — Wall Street targets run 12 to 18 months out. Sites quoting a 2030 price for TTAM are extrapolating price history, which says nothing about the business. The furthest attributed numbers are the current analyst targets: $15 to $22 over the next 12 months.

How has TTAM stock performed over the past year?

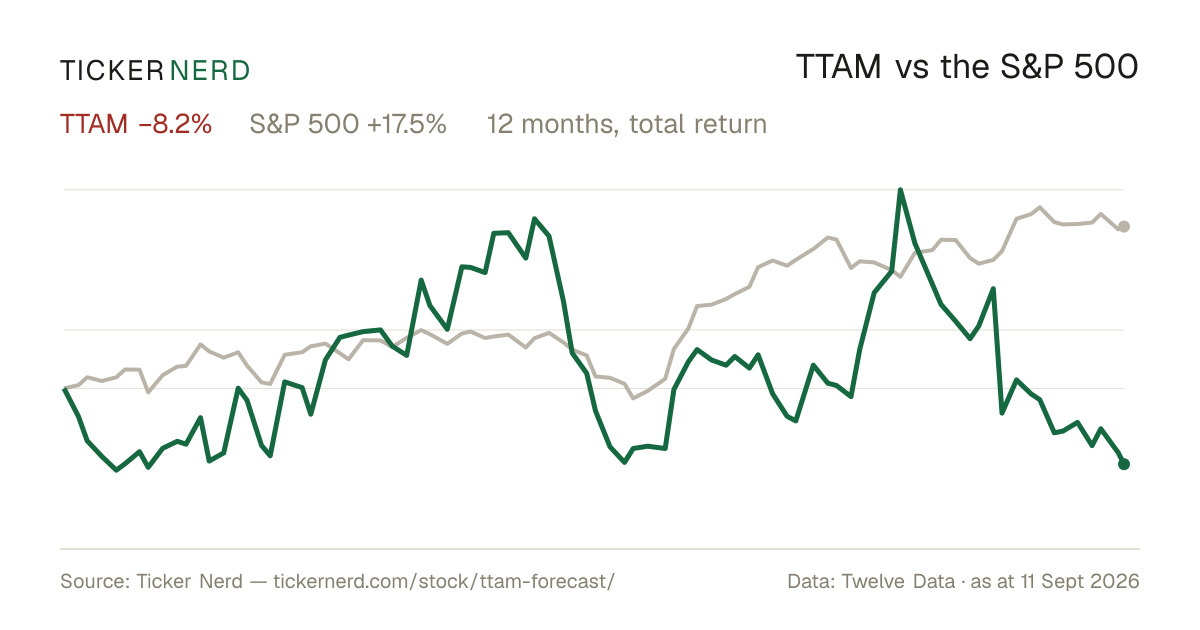
Titan America SA returned +16.0% over the 12 months to 3 Aug 2026, with dividends reinvested. Past performance does not indicate future returns.

What does Titan America SA do?

Titan America S.A. is a prominent player in the construction materials industry, primarily focusing on the production and supply of cement and related materials.

What is the latest news on TTAM?

The most recent item we track (Zacks Investment Research, 30 July 2026): "TTAM vs. IBP: Which Stock Is the Better Value Option?". Zacks Investment Research published a comparison between Titan America (TTAM) and Installed Building Products (IBP), examining which stock offers more value for investors in the Building Products sector.

Company

About Titan America SA.

Titan America S.A. is a prominent player in the construction materials industry, primarily focusing on the production and supply of cement and related materials. As a subsidiary of Titan Cement Group, the company operates extensively across North America, offering a robust portfolio of products that serve the diverse needs of the construction sector. Titan America's product range includes standard and specialty types of cement, as well as ready-mix concrete and aggregates. These materials are essential components in infrastructure development, residential, and commercial construction projects. The company plays a critical role in supporting sustainable development through innovative practices and a commitment to reducing environmental impact. By integrating advanced technological solutions and adhering to strict quality standards, Titan America aims to optimize the lifecycle performance of its products. With strategic facilities located throughout the United States, it ensures efficient distribution and accessibility. In the financial market, Titan America represents a vital link in the supply chain of construction essentials, influencing sectors such as real estate, urban planning, and transportation development. Its operations contribute significantly to economic development by enabling construction activities that drive growth and modernization.

CEO Mr. Vassilios S. Zarkalis · 2,554 employees · Belgium · https://titanamerica.com