VSTSVSTSIndustrials · Rental & Leasing Services

VSTS Stock Forecast: Vestis Corp. Price Predictions for 2026-2027

Last close, 18 Sept 2026
$14
−0.14% on the day

The 8 Wall Street analysts covering Vestis Corp. hold a median 12-month price target of $13 — -5.9% from the last close. Ticker Nerd's systematic factor model, run across ~4,600 US stocks, ranks it 94 of 100 as at 19 Sept 2026 — among the strongest tenth. The factors read stronger than the Street's target implies. That gap is the story on this page.

Market cap
$1.8B
Ticker Nerd rank
94 / 100
Median analyst target
$13
Analysts covering
8
Revenue$661.7M−1.8% y/y
Operating income$37.2M
Net income$11.0M
Free cash flow$47.0M
Quarterly, 8 quarters to 30 June 2026 · latest quarter's figure shown
Total return, dividends reinvested
1W
+6.6%
1M
+6.2%
YTD
+107.2%
1Y
+233.0%
From 52W high
−16.2%
From 52W low
+238.7%
$4
$17
52-week range, adjusted closes · the dot is the last close
Ticker Nerd rank

VSTS stock analysis: one number for the whole business

Consensus tells you what everyone already believes. The model scores Vestis Corp. on its factor families — the same systematic rank behind the Ticker Nerd portfolio.

Where the model ranks itAs at 19 Sept 2026
94 / 100

Percentile across ~4,600 US stocks on Ticker Nerd’s systematic factor model. Higher is better. How the model is built and tested

Momentum
95
Revisions
88
Accruals
88
Issuance
86
Growth
75
Value
63
Volatility
40
Quality
39
Size
37

Momentum (95): The shares have been drifting up relative to others.

Quality (39): Profits are thin or unreliable for the size of the business, or they are not turning into cash.

Size (37): Larger than most of the companies we track — more scrutinised, less often mispriced.

Built and run by Aslam Ghouse, an ex-Goldman Sachs quant trader with fourteen years in markets.

Wall Street

VSTS stock forecast 2026-2027: analyst price targets & predictions

The bullish and bearish analyst opinions on VSTS, reported as data — targets and ratings, the market's view beside the model's.

Share price and the analyst range, 12 monthsAdjusted close, US dollars
$5$10$15Oct 25Jan 26Apr 26Jul 26VSTSHigh $17Median $13Low $9

Price targets and ratings are third-party analyst estimates, reported here as data. They are not Ticker Nerd forecasts, and they are frequently wrong.

Data provided by Twelve Data

What Wall Street says8 analysts
2 Buy3 Hold3 Sell
Low $9Median $13High $17

The green dot is the last close — the median target sits −5.9% from it.

Recent analyst actionsNewest first

Of the 20 most recent actions, 8 moved their price target up and 0 moved it down.

DateFirmActionRatingTarget
13 Aug 2026BarclaysMaintainsUnderweight$9.00$11
13 Aug 2026JP MorganMaintainsUnderweight$11$13
12 Aug 2026BairdMaintainsNeutral$15$16
12 Aug 2026Goldman SachsMaintainsSell$8.20$9.30
12 Aug 2026StifelMaintainsHold$11$14
15 May 2026BarclaysMaintainsUnderweight$6.00$9.00
15 May 2026BarclaysMaintainsUnderweight
13 May 2026BairdMaintainsNeutral$10$14
13 May 2026BairdMaintainsNeutral
13 May 2026StifelMaintainsHold
13 May 2026StifelMaintainsHold$8.50$11
13 May 2026William BlairUpgradeOutperform
11 Feb 2026Goldman SachsMaintainsSell
8 Jan 2026Goldman SachsDowngradeSell
3 Dec 2025Goldman SachsMaintainsNeutral
3 Dec 2025JP MorganMaintainsUnderweight
2 Dec 2025BairdMaintainsNeutral
7 Aug 2025JP MorganMaintainsUnderweight
14 July 2025JP MorganDowngradeUnderweight

Price targets and ratings are third-party analyst estimates, reported here as data. They are not Ticker Nerd forecasts, and they are frequently wrong.

Market Radar

This page is one stock. Monday covers all of them.

Computed off the Friday close and sent before the US open.

Market Radar reports the week’s largest rank changes across roughly 4,600 US stocks, the factor behind each one, and where the market went. VSTS appears on the weeks it earns a place.

Free, every Monday. Unsubscribe any time.

Performance

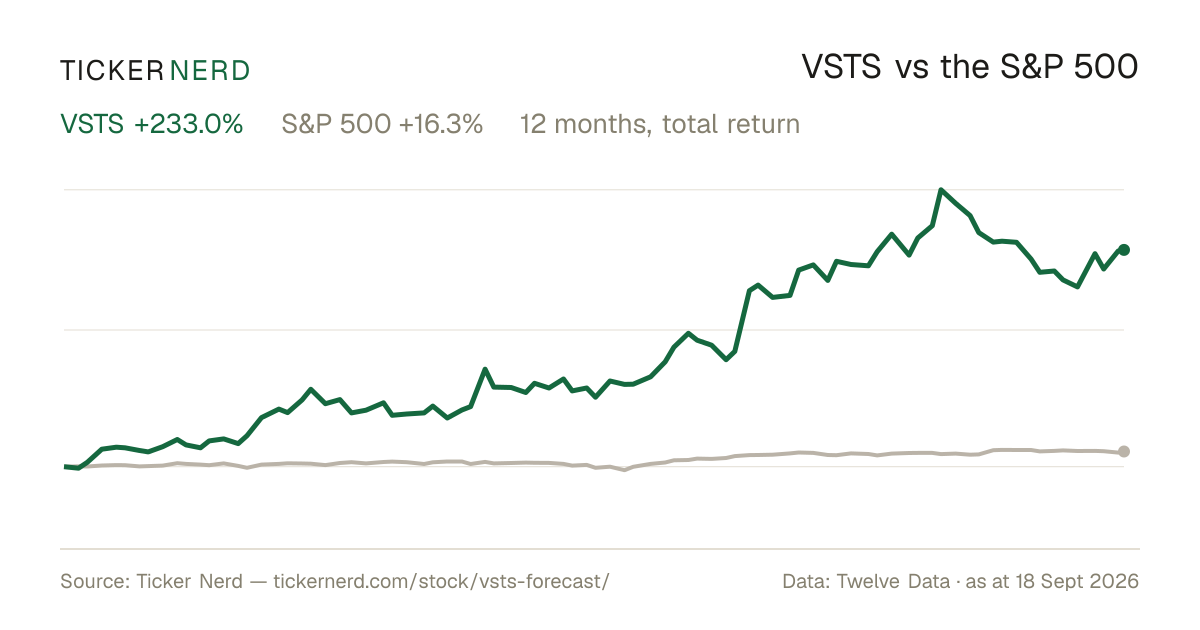
VSTS vs the S&P 500

Both lines are total return — dividends reinvested — so the comparison is honest on both sides.

Over the twelve months to 18 Sept 2026, Vestis Corp. returned +233.0% against +16.3% for the S&P 500, dividends included.

VSTS vs S&P 500, last 12 monthsTotal return, rebased to 100
100200300400Oct 25Jan 26Apr 26Jul 26VSTSS&P 500

Download this chart as an image — free to reuse; link this page as the source.

Data provided by Twelve Data

Estimates

VSTS analyst estimate revisions

Not the forecast itself — the direction analysts are revising it. Revision direction is one of the model's factor families.

Which way the estimates are movingNext fiscal year
EPS revision, 90 days
+26.3%
Analysts raising
7
Analysts cutting
0
Fundamentals

Vestis Corp. (VSTS) financial data

A margin means little on its own. Each bar marks where the figure sits across the whole US universe we score.

Valuation
Trailing P/E
108.7×

Cheaper than 6% of US stocks

Price / sales
0.7×

Cheaper than 77% of US stocks

Price / book
2.1×

Cheaper than 44% of US stocks

EV / EBITDA
12.3×

Cheaper than 29% of US stocks

Growth & margins
Revenue growth (YoY)
−1.8%

Higher than 24% of US stocks

Earnings growth (YoY)
−1.8%

Higher than 34% of US stocks

Gross margin
28.0%

Higher than 31% of US stocks

Operating margin
5.9%

Higher than 57% of US stocks

Net margin
−0.2%

Higher than 30% of US stocks

Returns & dividend
Return on equity
−0.6%

Higher than 43% of US stocks

Return on assets
2.5%

Higher than 62% of US stocks

Dividend yield
1.0%

Higher than 22% of US dividend payers

Bars mark the percentile across the ~4,600 US stocks Ticker Nerd covers, among those reporting the figure.

Key statistics

Vestis Corp. (VSTS) statistics: revenue, profit & scale

The headline figures, each with its date. Every row carries its own link — cite it straight from here.

  • Vestis Corp. has a market value of $1.8B and an enterprise value of $3.1B.

  • Revenue in the twelve months to 30 June 2026: $2.7B. The latest quarter shrank 1.8% year on year.

  • Net income over the same four quarters: −$5.3M, a −0.2% net margin.

  • Diluted earnings per share, trailing twelve months: $−0.05.

  • Free cash flow in the twelve months to 30 June 2026: $136.4M.

  • Vestis Corp. spent $0.0 on dividends in the twelve months to 30 June 2026.

  • Shares outstanding: 132.2M.

  • Trailing P/E: 108.7×; forward P/E: 17.8× — the forward figure prices analyst consensus estimates, not reported earnings.

  • Forward dividend yield: 1.01%, paying out 0% of earnings.

  • Vestis Corp. employs 18,150 people $149K of revenue per employee.

Statement figures: company filings via Twelve Data, four quarters to 30 June 2026 · market figures as at 18 Sept 2026

Data provided by Twelve Data

Peers

VSTS vs competitors

The nearest names by industry and size, scored by the same model — like for like.

Its peer group, ranked by the same modelRental & Leasing Services
CompanyMarket capTKN rank
VSTSVestis Corp.$1.8B
94
LIMENeutron Holdings, Inc.$2.0B
1
CTOSCustom Truck One Source, Inc.$2.1B
68
PRGPROG Holdings, Inc.$1.4B
80
MGRCMcGrath RentCorp$2.7B
63
WLFCWillis Lease Finance Corp.$1.1B
87
WSCWillScot Holdings Corp.$3.3B
52

Look up any of the roughly 4,600 stocks we score.

The rank is the raw material. Whether the rules would actually own Vestis Corp. — and when they’d sell — is the membership. See the Ticker Nerd 20 →

News

Latest VSTS news & analysis

Has Vestis Corporation (VSTS) Outpaced Other Industrial Products Stocks This Year?

Zacks Investment Research · 17 Sept 2026neutral

Zacks Investment Research examines how Vestis (VSTS) and Vestas Wind Systems (VWDRY) have performed compared to their industrial products sector so far this year. The piece compares the year-to-date performance of both stocks against their sector.

Why it matters — VSTS watchers would care because it provides context on how the company's stock has fared relative to its sector peers over the year.

Down 14.4% in 4 Weeks, Here's Why You Should You Buy the Dip in Vestis (VSTS)

Zacks Investment Research · 2 Sept 2026positive

Vestis (VSTS) has become technically oversold, suggesting the heavy selling pressure may be exhausted. This, combined with Wall Street analysts revising earnings estimates higher, indicates a potential near-term trend reversal for the stock.

Why it matters — VSTS watchers would care because the combination of an oversold technical position and upward analyst estimate revisions points to a possible shift in the stock's momentum.

Vestis: Revenue Growth Needs To Return, Reiterate A Hold

Seeking Alpha · 17 Aug 2026neutral

Seeking Alpha reiterated a 'Hold' rating on Vestis, citing ongoing revenue weakness and uncertainty around execution of the new business model. Q3 showed improved margins and EBITDA from exiting lower-quality volume and focusing on higher-value route-servicing contracts, with transformation initiatives delivering roughly $30M of the targeted ~$50M FY2026 savings.

Why it matters — Vestis watchers would care because the report highlights that margin improvements must be accompanied by a return to revenue growth for the company's transformation to be seen as successful.

Vestis (VSTS) Upgraded to Buy: What Does It Mean for the Stock?

Zacks Investment Research · 13 Aug 2026positive

Vestis (VSTS) has been upgraded to a Zacks Rank #2 (Buy), reflecting growing optimism about the company's earnings prospects. The upgrade suggests the stock may perform more strongly in the near term.

Why it matters — The upgrade signals increasing analyst confidence in Vestis's earnings outlook, which is directly relevant for those tracking the company's stock performance.

Did Vestis Corporation Insiders Breach their Fiduciary Duties to Shareholders?

PRNewsWire · 12 Aug 2026negative

A law firm is investigating whether Vestis Corporation insiders breached their fiduciary duties to shareholders and is encouraging shareholders to contact them to discuss their legal rights and options.

Why it matters — The investigation raises the possibility of legal action against the company's leadership, which could impact investor confidence and the company's reputation.

FAQ

Frequently asked questions about VSTS stock

What is the VSTS stock price forecast for 2026-2027?

The 8 Wall Street analysts covering Vestis Corp. have a median 12-month price target of $13, with estimates ranging from $9.3 to $17. These are third-party analyst estimates, not Ticker Nerd forecasts, and they are frequently wrong.

Is VSTS stock a buy right now?

Of the 8 analysts covering Vestis Corp., 2 rate it a Buy, 3 a Hold and 3 a Sell. Ticker Nerd's systematic factor model ranks Vestis Corp. 94 out of 100 across roughly 4,600 US stocks as at 19 Sept 2026. None of this is personal advice — it does not consider your circumstances.

How does Ticker Nerd's model rank VSTS?

As at 19 Sept 2026, Vestis Corp. ranks 94 out of 100 on Ticker Nerd's systematic factor model — a percentile across roughly 4,600 US stocks, built from its factor families. Its strongest factor family is Momentum (95 of 100).

Will VSTS stock go up?

No one can know that. What the data says: the median 12-month target from 8 analysts implies -5.9% from the last close, and Ticker Nerd's factor model ranks Vestis Corp. 94 out of 100 as at 19 Sept 2026. Analyst targets are third-party estimates and frequently wrong; none of this is personal advice.

What is the VSTS stock forecast for 2030?

No analyst covering Vestis Corp. publishes a 2030 price target — Wall Street targets run 12 to 18 months out. Sites quoting a 2030 price for VSTS are extrapolating price history, which says nothing about the business. The furthest attributed numbers are the current analyst targets: $9.3 to $17 over the next 12 months.

How has VSTS stock performed over the past year?

Vestis Corp. returned +233.0% over the 12 months to 18 Sept 2026, with dividends reinvested. Past performance does not indicate future returns.

What does Vestis Corp. do?

Vestis Corporation Common Stock is the equity security of Vestis Corporation, a business-to-business provider of uniform rentals and workplace supplies. Vestis serves customers across the United States and Canada with services that include full-service uniform programs, specialty garment processing, floor mats, towels, linens, managed restroom services, first aid supplies, and other workplace essentials.

What is the latest news on VSTS?

The most recent item we track (Zacks Investment Research, 17 Sept 2026): "Has Vestis Corporation (VSTS) Outpaced Other Industrial Products Stocks This Year?". Zacks Investment Research examines how Vestis (VSTS) and Vestas Wind Systems (VWDRY) have performed compared to their industrial products sector so far this year. The piece compares the year-to-date performance of both stocks against their sector.

Company

About Vestis Corp.

Vestis Corporation Common Stock is the equity security of Vestis Corporation, a business-to-business provider of uniform rentals and workplace supplies. Vestis serves customers across the United States and Canada with services that include full-service uniform programs, specialty garment processing, floor mats, towels, linens, managed restroom services, first aid supplies, and other workplace essentials. The company supports a broad range of industries, including manufacturing, healthcare, hospitality, food service, retail, pharmaceuticals, automotive, and cleanroom environments. Its offerings are designed for organizations ranging from small businesses to large enterprises that need consistent, outsourced workplace appearance and hygiene solutions. Vestis Corporation Common Stock represents ownership in a company focused on recurring service relationships within the commercial services sector, where uniforms and facility-support products are used to help businesses maintain operational standards and employee presentation.

CEO Mr. James Jay Barber Jr. · 18,150 employees · United States · https://www.vestis.com