WBDCommunication Services · Entertainment

WBD Stock Forecast: Warner Bros. Discovery, Inc. Price Predictions for 2026-2027

Last close, 5 Oct 2026
$31
+0.03% on the day

The 12 Wall Street analysts covering Warner Bros. Discovery, Inc. hold a median 12-month price target of $31 — +0.2% from the last close.

Market cap
$77.6B
Ticker Nerd rank
—/ 100
Median analyst target
$31
Analysts covering
12
Revenue$8.7B−11.2% y/y
Operating income$373.0M
Net income$162.0M
Free cash flow$572.0M
Quarterly, 8 quarters to 30 June 2026 · latest quarter's figure shown
Total return, dividends reinvested
1W
+0.2%
1M
+9.6%
YTD
+7.4%
1Y
+63.0%
From 52W high
0.0%
From 52W low
+81.0%
$17
$31
52-week range, adjusted closes · the dot is the last close
Ticker Nerd rank

WBD stock analysis: one number for the whole business

Consensus tells you what everyone already believes. The model scores Warner Bros. Discovery, Inc. on its factor families — the same systematic rank behind the Ticker Nerd portfolio.

We don’t hold a current model rank for this company.

Built and run by Aslam Ghouse, an ex-Goldman Sachs systematic trader with 15+ years in markets.

Wall Street

WBD stock forecast 2026-2027: analyst price targets & predictions

The bullish and bearish analyst opinions on WBD, reported as data — targets and ratings, the market's view beside the model's.

Share price and the analyst range, 12 monthsAdjusted close, US dollars
$20$25$30Jan 26Apr 26Jul 26Oct 26WBDHigh $31Median $31Low $28

Price targets and ratings are third-party analyst estimates, reported here as data. They are not Ticker Nerd forecasts, and they are frequently wrong.

Data provided by Twelve Data

What Wall Street says12 analysts
2 Buy10 Hold0 Sell
Low $28Median $31High $31

The green dot is the last close — the median target sits +0.2% from it.

Recent analyst actionsNewest first
DateFirmActionRatingTarget
29 Sept 2026Argus ResearchDowngradeSell—
22 Sept 2026Morgan StanleyMaintainsEqual-Weight$29 → $31
17 Sept 2026BarclaysReinstatesEqual-Weight$29
18 Aug 2026Argus ResearchReiteratesBuy—
27 July 2026Seaport GlobalDowngradeNeutral—
29 June 2026Seaport GlobalUpgradeBuy$31
29 June 2026Seaport GlobalUpgradeBuy—
7 May 2026GuggenheimReiteratesNeutral—
7 May 2026UBSMaintainsNeutral—
10 Mar 2026Freedom BrokerMaintainsHold—
9 Mar 2026Wells FargoReinstatesEqual-Weight$31
27 Feb 2026BenchmarkDowngradeHold—
27 Feb 2026Raymond JamesDowngradeUnderperform—
27 Feb 2026TD CowenMaintainsHold—
25 Feb 2026BernsteinMaintainsMarket Perform—
28 Jan 2026UBSMaintainsNeutral—
15 Jan 2026BenchmarkMaintainsBuy—
14 Jan 2026GuggenheimMaintainsNeutral—
10 Dec 2025Freedom BrokerMaintainsHold—

Price targets and ratings are third-party analyst estimates, reported here as data. They are not Ticker Nerd forecasts, and they are frequently wrong.

Market Radar

This page is one stock. Monday covers all of them.

WBD appears in the Radar on the weeks it earns a place.

  • Market Radar, every Monday: the week's biggest rank moves across ~4,600 US stocks, and the reason for each.
  • The AI build-out map, free: every AI company we track, part by part, and one part in full with each verdict.

Free. Unsubscribe any time.

The AI build-out map
PDF
  • AI cloud capacity

    MSFTAMZNGOOGLORCL

  • AI chips

    NVDAAVGOAMDMU

  • AI networking and serversIn full

    ANETDELLLITECRDO

  • Data centre power

    VRTCEGGEVVST

Performance

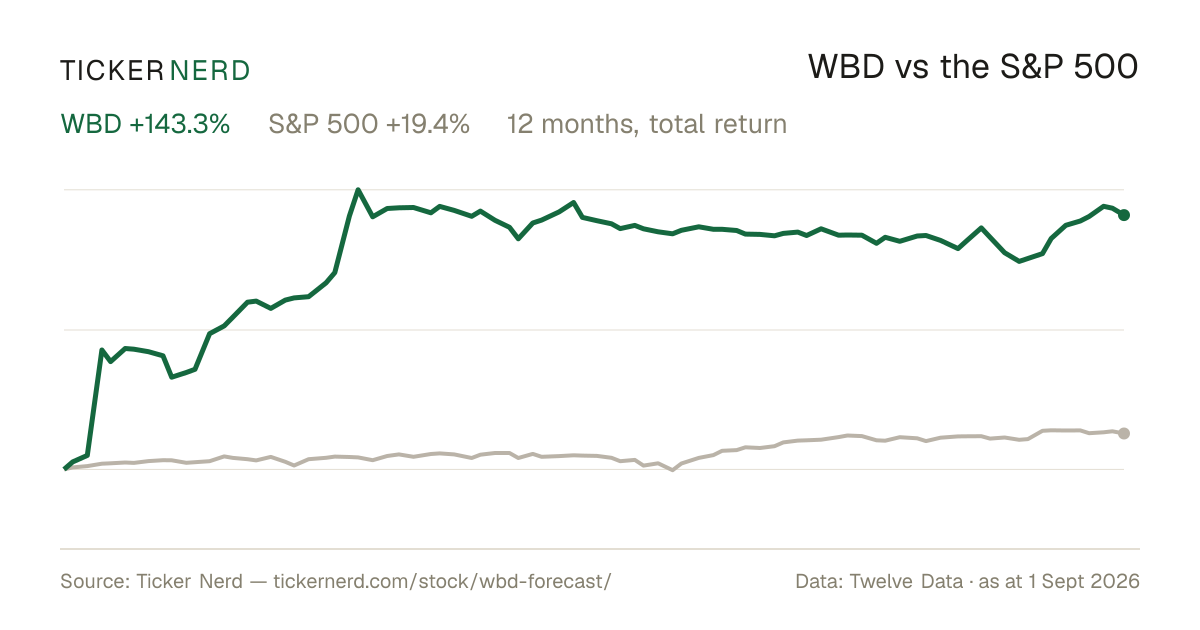
WBD vs the S&P 500

Both lines are total return — dividends reinvested — so the comparison is honest on both sides.

Over the twelve months to 5 Oct 2026, Warner Bros. Discovery, Inc. returned +63.0% against +17.0% for the S&P 500, dividends included.

WBD vs S&P 500, last 12 monthsTotal return, rebased to 100
80100120140160Jan 26Apr 26Jul 26Oct 26WBDS&P 500

Download this chart as an image — free to reuse; link this page as the source.

Data provided by Twelve Data

Estimates

WBD analyst estimate revisions

Not the forecast itself — the direction analysts are revising it. Revision direction is one of the model's factor families.

Which way the estimates are movingThis fiscal year
Analysts raising
0
Analysts cutting
1
Fundamentals

Warner Bros. Discovery, Inc. (WBD) financial data

A margin means little on its own. Each bar marks where the figure sits across the whole US universe we score.

Valuation
Trailing P/E
93.9×

Cheaper than 7% of US stocks

Price / sales
2.1×

Cheaper than 48% of US stocks

Price / book
2.4×

Cheaper than 36% of US stocks

EV / EBITDA
13.8×

Cheaper than 25% of US stocks

Growth & margins
Revenue growth (YoY)
−11.2%

Higher than 15% of US stocks

Earnings growth (YoY)
−90.6%

Higher than 3% of US stocks

Gross margin
47.0%

Higher than 58% of US stocks

Operating margin
5.1%

Higher than 54% of US stocks

Net margin
−8.8%

Higher than 20% of US stocks

Returns & dividend
Return on equity
−8.8%

Higher than 36% of US stocks

Return on assets
1.7%

Higher than 56% of US stocks

Dividend yield
0.0%

Higher than 1% of US dividend payers

Bars mark the percentile across the ~4,600 US stocks Ticker Nerd covers, among those reporting the figure.

Key statistics

Warner Bros. Discovery, Inc. (WBD) statistics: revenue, profit & scale

The headline figures, each with its date. Every row carries its own link — cite it straight from here.

  • Warner Bros. Discovery, Inc. has a market value of $77.6B and an enterprise value of $107.5B.

  • Revenue in the twelve months to 30 June 2026: $36.1B. The latest quarter shrank 11.2% year on year.

  • Net income over the same four quarters: −$3.1B, a −8.7% net margin.

  • Free cash flow in the twelve months to 30 June 2026: $2.2B.

  • Shares outstanding: 2.5B.

  • Trailing P/E: 93.9×; forward P/E: −1238.0× — the forward figure prices analyst consensus estimates, not reported earnings.

  • Forward dividend yield: 0.00%, paying out 0% of earnings.

  • Warner Bros. Discovery, Inc. employs 35,500 people — $1.0M of revenue per employee.

Statement figures: company filings via Twelve Data, four quarters to 30 June 2026 · market figures as at 3 Nov 2026

Data provided by Twelve Data

Peers

WBD vs competitors

The nearest names by industry and size, scored by the same model — like for like.

Its peer group, ranked by the same modelEntertainment
CompanyMarket capTKN rank
WBDWarner Bros. Discovery, Inc.$77.6B—
GOOGLAlphabet, Inc.*$3.5T47
METAMeta Platforms, Inc.*$1.5T47
NFLXNetflix, Inc.$267.7B53
DISThe Walt Disney Co.$206.8B52
VZVerizon Communications, Inc.*$192.6B60
TMUST-Mobile US, Inc.*$173.8B73

* Nearest Communication Services names by size — few entertainment companies of this scale trade in the US universe.

Look up any of the roughly 4,600 stocks we score.

The rank is the raw material. Whether the rules would actually own Warner Bros. Discovery, Inc. — and when they’d sell — is the membership. See the Ticker Nerd 20 →

News

Latest WBD news & analysis

Skydance Plans to Cut $6 Billion in Costs Following Warner Bros. Deal

WSJ · 9 Nov 2026neutral

Skydance plans to cut $6 billion in costs following its Warner Bros. deal. The planned reductions include eliminating management layers, combining operations and reducing technology expenses.

Why it matters — The cost-cutting plan could affect Warner Bros. operations and expenses following the deal.

Paramount and Warner Bros.: The $110 Billion Bet That Could Reshape Streaming

The Motley Fool · 5 Nov 2026neutral

The Motley Fool excerpt identifies an episode in which contributors Travis Hoium, Lou Whiteman, and Matt Frankel discuss Paramount and Warner Bros. and a $110 billion bet that could reshape streaming.

Why it matters — The discussion concerns Warner Bros. and the streaming landscape, making it relevant to WBD watchers.

Warner Bros. Pictures Animation and Amazon Ads Invite Audiences to Play Inside the World of The Cat in the Hat Ahead of Film's Premiere

Business Wire · 26 Oct 2026positive

Warner Bros. Pictures Animation and Amazon Ads launched “Open to Fun,” a multi-channel campaign promoting the animated feature The Cat in the Hat, which is scheduled to arrive in theaters November 6. Amazon Ads’ Brand Innovation Lab developed the activation to bring the character into customers’ daily lives.

Why it matters — The campaign highlights a promotional collaboration supporting a Warner Bros. Pictures Animation theatrical release.

FAQ

Frequently asked questions about WBD stock

What is the WBD stock price forecast for 2026-2027?

The 12 Wall Street analysts covering Warner Bros. Discovery, Inc. have a median 12-month price target of $31, with estimates ranging from $28 to $31. These are third-party analyst estimates, not Ticker Nerd forecasts, and they are frequently wrong.

Is WBD stock a buy right now?

Of the 12 analysts covering Warner Bros. Discovery, Inc., 2 rate it a Buy, 10 a Hold and 0 a Sell. None of this is personal advice — it does not consider your circumstances.

Will WBD stock go up?

No one can know that. What the data says: the median 12-month target from 12 analysts implies +0.2% from the last close. Analyst targets are third-party estimates and frequently wrong; none of this is personal advice.

What is the WBD stock forecast for 2030?

No analyst covering Warner Bros. Discovery, Inc. publishes a 2030 price target — Wall Street targets run 12 to 18 months out. Sites quoting a 2030 price for WBD are extrapolating price history, which says nothing about the business. The furthest attributed numbers are the current analyst targets: $28 to $31 over the next 12 months.

How has WBD stock performed over the past year?

Warner Bros. Discovery, Inc. returned +63.0% over the 12 months to 5 Oct 2026, with dividends reinvested. Past performance does not indicate future returns.

What does Warner Bros. Discovery, Inc. do?

Warner Bros. Discovery, Inc.

What is the latest news on WBD?

The most recent item we track (WSJ, 9 Nov 2026): "Skydance Plans to Cut $6 Billion in Costs Following Warner Bros. Deal". Skydance plans to cut $6 billion in costs following its Warner Bros. deal. The planned reductions include eliminating management layers, combining operations and reducing technology expenses.

Company

About Warner Bros. Discovery, Inc.

Warner Bros. Discovery, Inc. is a global media and entertainment company that creates, produces, and distributes content across television, film, streaming, and gaming. The company operates a broad portfolio of brands and services, including premium streaming platforms, cable networks, news programming, sports content, and film and television studios. Its business segments span streaming and studios as well as linear networks, supporting a wide range of audiences through entertainment, lifestyle, factual, kids, and sports offerings. Warner Bros. Discovery also extends into consumer products, licensing, publishing, and themed experiences, making it a diversified content provider with a significant role in global media distribution and franchise development. Headquartered in New York City, Warner Bros. Discovery serves households, advertisers, distributors, and commercial partners through its portfolio of well-known entertainment brands.

CEO Mr. David M. Zaslav · 35,500 employees · United States · https://www.wbd.com