NFLXNFLXCommunication Services · Entertainment

NFLX Stock Forecast: Netflix, Inc. Price Predictions for 2026-2027

Last close, 24 Sept 2026
$72
+0.50% on the day

The 51 Wall Street analysts covering Netflix, Inc. hold a median 12-month price target of $92 — +28.3% from the last close. Ticker Nerd's systematic factor model, run across ~4,600 US stocks, ranks it 59 of 100 as at 23 Sept 2026 — in the upper half.

Market cap
$297.1B
Ticker Nerd rank
59 / 100
Median analyst target
$92
Analysts covering
51
Revenue$12.6B+13.4% y/y
Operating income$4.2B
Net income$3.4B
Free cash flow$1.5B
Quarterly, 8 quarters to 30 June 2026 · latest quarter's figure shown
Total return, dividends reinvested
1W
−4.8%
1M
−10.4%
YTD
−23.5%
1Y
−40.4%
From 52W high
−42.2%
From 52W low
+6.1%
$68
$124
52-week range, adjusted closes · the dot is the last close
Ticker Nerd rank

NFLX stock analysis: one number for the whole business

Consensus tells you what everyone already believes. The model scores Netflix, Inc. on its factor families — the same systematic rank behind the Ticker Nerd portfolio.

Where the model ranks itAs at 23 Sept 2026
59 / 100

Percentile across ~4,600 US stocks on Ticker Nerd’s systematic factor model. Higher is better. How the model is built and tested

Volatility
96
Quality
95
Issuance
89
Value
66
Growth
64
Revisions
62
Accruals
29
Momentum
11
Size
1

Volatility (96): The share price has been relatively steady.

Momentum (11): The shares have been drifting down relative to others.

Size (1): Larger than most of the companies we track — more scrutinised, less often mispriced.

Built and run by Aslam Ghouse, an ex-Goldman Sachs quant trader with fourteen years in markets.

Wall Street

NFLX stock forecast 2026-2027: analyst price targets & predictions

The bullish and bearish analyst opinions on NFLX, reported as data — targets and ratings, the market's view beside the model's.

Share price and the analyst range, 12 monthsAdjusted close, US dollars
$60$80$100$120$140Oct 25Jan 26Apr 26Jul 26NFLXHigh $135Median $92Low $57

Price targets and ratings are third-party analyst estimates, reported here as data. They are not Ticker Nerd forecasts, and they are frequently wrong.

Data provided by Twelve Data

What Wall Street says51 analysts
34 Buy16 Hold1 Sell
Low $57Median $92High $135

The green dot is the last close — the median target sits +28.3% from it.

Recent analyst actionsNewest first

Of the 20 most recent actions, 2 moved their price target up and 8 moved it down.

DateFirmActionRatingTarget
18 Sept 2026Wells FargoDowngradeUnderweight$80 → $57
14 Sept 2026Evercore ISI GroupMaintainsOutperform$100 → $110
25 Aug 2026Wolfe ResearchMaintainsOutperform—
25 Aug 2026Wolfe ResearchMaintainsOutperform$84 → $95
22 July 2026BairdMaintainsOutperform$120 → $90
22 July 2026BairdMaintainsOutperform—
17 July 2026BarclaysMaintainsEqual-Weight—
17 July 2026BarclaysMaintainsEqual-Weight$85 → $80
17 July 2026BernsteinMaintainsOutperform$100 → $95
17 July 2026BernsteinMaintainsOutperform—
17 July 2026Evercore ISI GroupMaintainsOutperform—
17 July 2026Evercore ISI GroupMaintainsOutperform$115 → $100
17 July 2026Goldman SachsMaintainsBuy$110 → $94
17 July 2026Goldman SachsMaintainsBuy—
17 July 2026GuggenheimMaintainsBuy$120 → $75
17 July 2026GuggenheimMaintainsBuy—
17 July 2026JP MorganMaintainsOverweight$118 → $85
17 July 2026JP MorganMaintainsOverweight—
17 July 2026KGI SecuritiesDowngradeNeutral—
17 July 2026KGI SecuritiesDowngradeNeutral$75

Price targets and ratings are third-party analyst estimates, reported here as data. They are not Ticker Nerd forecasts, and they are frequently wrong.

Market Radar

This page is one stock. Monday covers all of them.

Computed off the Friday close and sent before the US open.

Market Radar reports the week’s largest rank changes across roughly 4,600 US stocks, the factor behind each one, and where the market went. NFLX appears on the weeks it earns a place.

Free, every Monday. Unsubscribe any time.

Performance

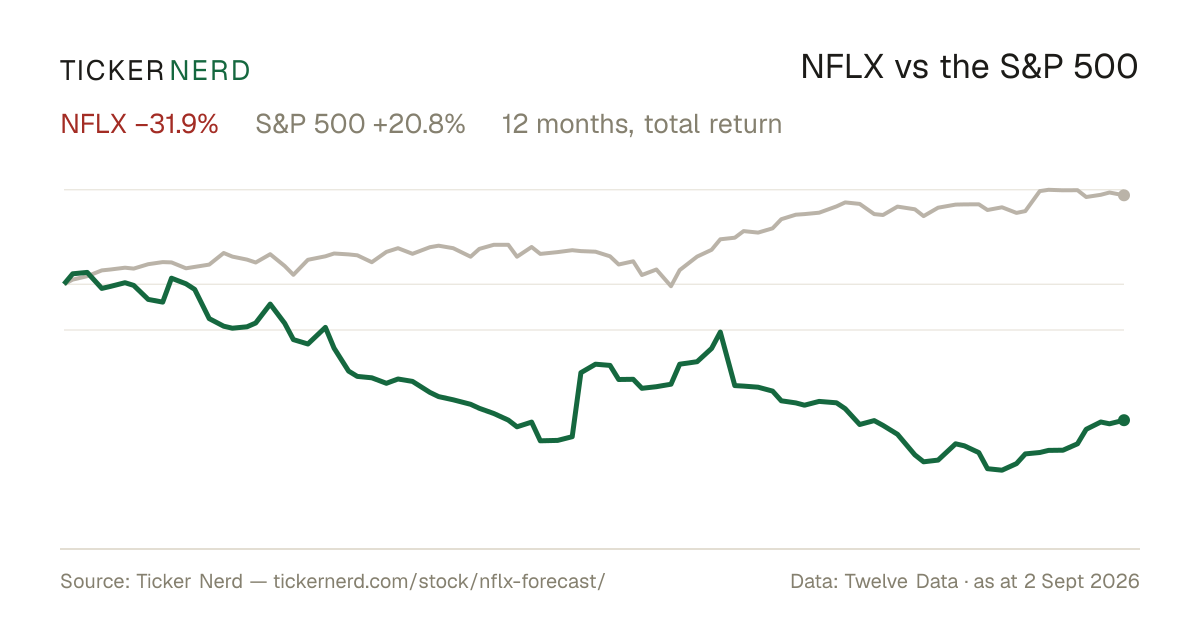
NFLX vs the S&P 500

Both lines are total return — dividends reinvested — so the comparison is honest on both sides.

Over the twelve months to 24 Sept 2026, Netflix, Inc. returned −40.4% against +17.4% for the S&P 500, dividends included.

NFLX vs S&P 500, last 12 monthsTotal return, rebased to 100
6080100120Oct 25Jan 26Apr 26Jul 26NFLXS&P 500

Download this chart as an image — free to reuse; link this page as the source.

Data provided by Twelve Data

Estimates

NFLX analyst estimate revisions

Not the forecast itself — the direction analysts are revising it. Revision direction is one of the model's factor families.

Which way the estimates are movingNext fiscal year
EPS revision, 90 days
−0.2%
Analysts raising
3
Analysts cutting
1
Fundamentals

Netflix, Inc. (NFLX) financial data

A margin means little on its own. Each bar marks where the figure sits across the whole US universe we score.

Valuation
Trailing P/E
22.4×

Cheaper than 33% of US stocks

Price / sales
6.1×

Cheaper than 21% of US stocks

Price / book
9.9×

Cheaper than 10% of US stocks

EV / EBITDA
20.9×

Cheaper than 14% of US stocks

Growth & margins
Revenue growth (YoY)
13.4%

Higher than 60% of US stocks

Earnings growth (YoY)
8.8%

Higher than 46% of US stocks

Gross margin
51.9%

Higher than 65% of US stocks

Operating margin
33.4%

Higher than 89% of US stocks

Net margin
28.2%

Higher than 88% of US stocks

Returns & dividend
Return on equity
49.5%

Higher than 93% of US stocks

Return on assets
16.1%

Higher than 98% of US stocks

Dividend yield
—

Bars mark the percentile across the ~4,600 US stocks Ticker Nerd covers, among those reporting the figure.

Key statistics

Netflix, Inc. (NFLX) statistics: revenue, profit & scale

The headline figures, each with its date. Every row carries its own link — cite it straight from here.

  • Netflix, Inc. has a market value of $297.1B and an enterprise value of $308.0B.

  • Revenue in the twelve months to 30 June 2026: $48.4B. The latest quarter grew 13.4% year on year.

  • Net income over the same four quarters: $13.6B, a 28.2% net margin.

  • Diluted earnings per share, trailing twelve months: $3.18.

  • Free cash flow in the twelve months to 30 June 2026: $11.2B, after $818.8M of capital spending.

  • Netflix, Inc. spent $9.9B on share buybacks in the twelve months to 30 June 2026.

  • Shares outstanding: 4.2B.

  • Trailing P/E: 22.4×; forward P/E: 18.7× — the forward figure prices analyst consensus estimates, not reported earnings.

  • Netflix, Inc. employs 16,000 people — $3.0M of revenue per employee.

Statement figures: company filings via Twelve Data, four quarters to 30 June 2026 · market figures as at 23 Sept 2026

Data provided by Twelve Data

Peers

NFLX vs competitors

The nearest names by industry and size, scored by the same model — like for like.

Its peer group, ranked by the same modelEntertainment
CompanyMarket capTKN rank
NFLXNetflix, Inc.$297.1B
59
DISThe Walt Disney Co.$183.3B
49
WBDWarner Bros. Discovery, Inc.$77.1B
48
LYVLive Nation Entertainment, Inc.$39.3B
41
TKOTKO Group Holdings, Inc.$36.7B
48
FOXAFox Corp.$25.4B
82
FWONKLiberty Media Corp.$23.1B
34

Look up any of the roughly 4,600 stocks we score.

The rank is the raw material. Whether the rules would actually own Netflix, Inc. — and when they’d sell — is the membership. See the Ticker Nerd 20 →

News

Latest NFLX news & analysis

Being Picky With Stocks More Important Than Ever

Seeking Alpha · 24 Sept 2026positive

Seeking Alpha experts Julia Ostian, Kenio Fontes, and Jack Bowman discussed investment opportunities in AI infrastructure, select defense, and undervalued tech stocks, citing Netflix and Uber as compelling options amid stretched valuations elsewhere. They emphasized patience and caution given high treasury yields competing with equities.

Why it matters — The piece highlights Netflix as an undervalued tech stock offering a compelling opportunity, which NFLX watchers would find relevant for assessing its relative value in the current market.

Disney Just Raised Prices Across Multiple Streaming Tiers. Here's How It Compares to Netflix and Paramount.

The Motley Fool · 24 Sept 2026neutral

Disney is raising prices across multiple standalone streaming tiers, partly to encourage more users to bundle its services. The company also plans to roll out a one-app experience that will let subscribers access all three services through a single interface.

Why it matters — A Disney price increase and bundling push changes the competitive pricing landscape for streaming, providing context for how Netflix positions its own subscription tiers.

Netflix Is Down 42% in a Year and the Investor Who Exited in June Just Bought Back In

24/7 Wall Street · 24 Sept 2026positive

Steve Weiss, founder and managing partner of Short Hills Capital Partners, said on CNBC's Halftime Report on September 23, 2026 that he had added to his Netflix position after a Wells Fargo downgrade. He had previously exited his stake in June, while Netflix shares were down 42% over the past year.

Why it matters — A prominent investor who previously sold Netflix has chosen to buy back in following a bank downgrade, signalling renewed confidence in the stock amid a sharp one-year decline.

Netflix is losing viewing hours to YouTube and I don't see the way out | Sozzi Unleashed

Yahoo Finance · 23 Sept 2026negative

Netflix shares have had a rough two weeks, including a Wells Fargo downgrade. An HSBC note argues that YouTube is capturing more viewing hours from Netflix and that the gap is widening.

Why it matters — A Netflix watcher would care because competition from YouTube for viewing hours could weigh on Netflix's engagement amid recent share weakness and a downgrade.

Virtus SGA U.S. Large Cap Growth Q2 2026 Contributors And Detractors

Seeking Alpha · 23 Sept 2026negative

In its Q2 2026 review, the SGA U.S. Large Cap Growth portfolio returned 6.8% gross and 6.0% net, trailing the Russell 1000 Growth Index's 16.7% and the S&P 500's 15.2%. Netflix was named among the largest detractors from performance, along with Intuit and Salesforce, while Arm Holdings, Alphabet, and Nvidia were the largest contributors.

Why it matters — This flags Netflix as a notable underperformer within a major growth portfolio during the quarter, offering a signal about its relative performance for investors tracking large-cap growth holdings.

FAQ

Frequently asked questions about NFLX stock

What is the NFLX stock price forecast for 2026-2027?

The 51 Wall Street analysts covering Netflix, Inc. have a median 12-month price target of $92, with estimates ranging from $57 to $135. These are third-party analyst estimates, not Ticker Nerd forecasts, and they are frequently wrong.

Is NFLX stock a buy right now?

Of the 51 analysts covering Netflix, Inc., 34 rate it a Buy, 16 a Hold and 1 a Sell. Ticker Nerd's systematic factor model ranks Netflix, Inc. 59 out of 100 across roughly 4,600 US stocks as at 23 Sept 2026. None of this is personal advice — it does not consider your circumstances.

How does Ticker Nerd's model rank NFLX?

As at 23 Sept 2026, Netflix, Inc. ranks 59 out of 100 on Ticker Nerd's systematic factor model — a percentile across roughly 4,600 US stocks, built from its factor families. Its strongest factor family is Volatility (96 of 100).

Will NFLX stock go up?

No one can know that. What the data says: the median 12-month target from 51 analysts implies +28.3% from the last close, and Ticker Nerd's factor model ranks Netflix, Inc. 59 out of 100 as at 23 Sept 2026. Analyst targets are third-party estimates and frequently wrong; none of this is personal advice.

What is the NFLX stock forecast for 2030?

No analyst covering Netflix, Inc. publishes a 2030 price target — Wall Street targets run 12 to 18 months out. Sites quoting a 2030 price for NFLX are extrapolating price history, which says nothing about the business. The furthest attributed numbers are the current analyst targets: $57 to $135 over the next 12 months.

How has NFLX stock performed over the past year?

Netflix, Inc. returned -40.4% over the 12 months to 24 Sept 2026, with dividends reinvested. Past performance does not indicate future returns.

What does Netflix, Inc. do?

Netflix Inc. is a global entertainment company that provides subscription-based streaming services for television series, films, documentaries, and live programming.

What is the latest news on NFLX?

The most recent item we track (Seeking Alpha, 24 Sept 2026): "Being Picky With Stocks More Important Than Ever". Seeking Alpha experts Julia Ostian, Kenio Fontes, and Jack Bowman discussed investment opportunities in AI infrastructure, select defense, and undervalued tech stocks, citing Netflix and Uber as compelling options amid stretched valuations elsewhere. They emphasized patience and caution given high treasury yields competing with equities.

Company

About Netflix, Inc.

Netflix Inc. is a global entertainment company that provides subscription-based streaming services for television series, films, documentaries, and live programming. The company offers a wide catalog of original productions and licensed content, delivered across internet-connected devices such as smart TVs, smartphones, tablets, and computers. Netflix also includes advertising-supported membership options and mobile games, broadening its service offering beyond on-demand video. Its business is organized around streaming entertainment for consumers in more than 190 countries and supports viewing in multiple languages and genres. Headquartered in Los Gatos, California, Netflix Inc. plays a major role in the digital media market by combining content licensing, production, and distribution within a single platform.

CEO Mr. Theodore A. Sarandos · 16,000 employees · United States · https://www.netflix.com