WWDWWDIndustrials · Aerospace & Defense

WWD Stock Forecast: Woodward, Inc. Price Predictions for 2026-2027

Last close, 3 Aug 2026
$364
+0.78% on the day

The 12 Wall Street analysts covering Woodward, Inc. hold a median 12-month price target of $440 — +21.0% from the last close. Ticker Nerd's systematic factor model, run across ~4,600 US stocks, ranks it 85 of 100 as at 1 Aug 2026 — inside the top quartile. Here, the model and the Street point the same way.

Market cap
$21.5B
Ticker Nerd rank
85 / 100
Median analyst target
$440
Analysts covering
12
Total return, dividends reinvested
1W
−13.4%
1M
−13.0%
YTD
+20.5%
1Y
+40.8%
From 52W high
−16.7%
From 52W low
+53.6%
$237
$436
52-week range, adjusted closes · the dot is the last close
Ticker Nerd rank

WWD stock analysis: one number for the whole business

Consensus tells you what everyone already believes. The model scores Woodward, Inc. on its factor families — the same systematic rank behind the Ticker Nerd portfolio.

Where the model ranks itAs at 1 Aug 2026
85 / 100

Percentile across ~4,600 US stocks on Ticker Nerd’s systematic factor model. Higher is better. How the model is built and tested

Quality
96
Revisions
87
Growth
85
Momentum
77
Volatility
77
Value
75
Issuance
45
Accruals
30
Size
10

Quality (96): The business earns solid, repeatable profits on what it owns.

Accruals (30): A large share of reported profit has not shown up as cash, or the balance sheet is expanding quickly — both tend to unwind.

Size (10): Larger than most of the companies we track — more scrutinised, less often mispriced.

The rank is the raw material. Whether the rules would actually own Woodward, Inc. — and when they’d sell — is the membership.

Wall Street

WWD stock forecast 2026-2027: analyst price targets & predictions

The bullish and bearish analyst opinions on WWD, reported as data — targets and ratings, the market's view beside the model's.

Share price and the analyst range, 12 monthsAdjusted close, US dollars
$250$300$350$400$450$500Oct 25Jan 26Apr 26Jul 26WWDHigh $502Median $440Low $415

Price targets and ratings are third-party analyst estimates, reported here as data. They are not Ticker Nerd forecasts, and they are frequently wrong.

What Wall Street says12 analysts
10 Buy2 Hold0 Sell
Low $415Median $440High $502

The green dot is the last close — the median target sits +21.0% from it.

Recent analyst actionsNewest first
DateFirmActionRatingTarget
30 July 2026RBC CapitalMaintainsOutperform$450$430
27 July 2026RBC CapitalReiteratesOutperform$450
13 July 2026TD CowenMaintainsHold$390$420
13 July 2026TD CowenMaintainsHold
26 May 2026SusquehannaInitiatesPositive
5 May 2026Truist SecuritiesMaintainsBuy
30 Apr 2026UBSMaintainsBuy
17 Apr 2026RBC CapitalInitiatesOutperform
1 Apr 2026Wells FargoInitiatesOverweight
9 Feb 2026Deutsche BankMaintainsBuy
4 Feb 2026Goldman SachsMaintainsBuy
3 Feb 2026TD CowenMaintainsHold
3 Feb 2026Truist SecuritiesMaintainsBuy
3 Feb 2026UBSMaintainsBuy
20 Jan 2026Goldman SachsMaintainsBuy
16 Jan 2026JefferiesMaintainsBuy
15 Jan 2026UBSMaintainsBuy
22 Dec 2025Deutsche BankMaintainsBuy
1 Dec 2025JefferiesMaintainsBuy
1 Dec 2025UBSMaintainsBuy

Price targets and ratings are third-party analyst estimates, reported here as data. They are not Ticker Nerd forecasts, and they are frequently wrong.

Estimates

WWD analyst estimate revisions

Not the forecast itself — the direction analysts are revising it. Revision direction is one of the model's factor families.

Which way the estimates are movingNext fiscal year
EPS revision, 90 days
+6.8%
Analysts raising
1
Analysts cutting
0
Fundamentals

Woodward, Inc. (WWD) financial data

A margin means little on its own. Each bar marks where the figure sits across the whole US universe we score.

Valuation
Trailing P/E
40.2×

Cheaper than 20% of US stocks

Price / sales
5.1×

Cheaper than 24% of US stocks

Price / book
8.5×

Cheaper than 12% of US stocks

EV / EBITDA
27.6×

Cheaper than 10% of US stocks

Growth & margins
Revenue growth (YoY)
21.2%

Higher than 73% of US stocks

Earnings growth (YoY)
35.2%

Higher than 71% of US stocks

Gross margin
31.5%

Higher than 38% of US stocks

Operating margin
17.8%

Higher than 78% of US stocks

Net margin
13.2%

Higher than 75% of US stocks

Returns & dividend
Return on equity
22.3%

Higher than 84% of US stocks

Return on assets
8.6%

Higher than 90% of US stocks

Dividend yield
0.4%

Higher than 6% of US dividend payers

Bars mark the percentile across the ~4,600 US stocks Ticker Nerd covers, among those reporting the figure.

Peers

WWD vs competitors

The nearest names by industry and size, scored by the same model — like for like.

Its peer group, ranked by the same modelAerospace & Defense
CompanyMarket capTKN rank
WWDWoodward, Inc.$21.5B
85
ARXSArxis, Inc.$22.0B
2
FTAIFTAI Aviation Ltd.$21.1B
38
CWCurtiss-Wright Corp.$26.7B
89
BWXTBWX Technologies, Inc.$15.4B
64
TXTTextron, Inc.$14.8B
79
HIIHuntington Ingalls Industries, Inc.$12.8B
76
Market Radar

This page is one stock. Monday covers all of them.

Computed off the Friday close and sent before the US open.

Market Radar reports the week’s largest rank changes across roughly 4,600 US stocks, the factor behind each one, and where the market went. WWD appears on the weeks it earns a place.

Free, every Monday. Unsubscribe any time.

News

Latest WWD news & analysis

Woodward (WWD) is an Incredible Growth Stock: 3 Reasons Why

Zacks Investment Research · 31 July 2026positive

Zacks Investment Research published an analysis highlighting Woodward (WWD) as an appealing growth stock, stating the company is well positioned to outperform the market due to above-average growth in its financials.

Why it matters — The report signals that analysts see Woodward's financial growth as a key strength, which may influence investor perception of the company's market position.

Woodward (WWD) May Find a Bottom Soon, Here's Why You Should Buy the Stock Now

Zacks Investment Research · 31 July 2026positive

The article notes that Woodward (WWD) has formed a hammer chart pattern after losing some value, indicating the stock has found support. An upward trend in earnings estimate revisions may lead to a trend reversal in the near term.

Why it matters — Investors tracking Woodward would be interested because chart patterns and estimate revisions are commonly used indicators of potential stock direction changes.

WWD Q3 Earnings Beat on Aerospace and Industrial Strength

Zacks Investment Research · 30 July 2026positive

Woodward reported a 43.2% increase in Q3 adjusted earnings, driven by growth in its aerospace and industrial segments, higher pricing, and increased volume. The company also raised its fiscal 2026 earnings guidance.

Why it matters — The strong earnings beat and upward guidance revision signal improved operational performance and brighter near-term prospects for Woodward's core businesses.

Woodward Q3 Earnings Call Highlights

MarketBeat · 30 July 2026positive

Woodward reported fiscal third-quarter results featuring double-digit sales growth, higher margins, and increased earnings, and subsequently raised its fiscal 2026 adjusted earnings guidance.

Why it matters — The strong quarterly performance and upward revision to earnings guidance signal accelerating momentum in Woodward's aerospace and industrial components businesses.

Woodward, Inc. (WWD) Q3 2026 Earnings Call Transcript

Seeking Alpha · 30 July 2026neutral

Woodward, Inc. released the transcript of its Q3 2026 earnings call, detailing the company's financial results and management commentary for the quarter.

Why it matters — The earnings call transcript provides Woodward investors and analysts with detailed financial results and management's assessment of the company's performance for the quarter.

FAQ

Frequently asked questions about WWD stock

What is the WWD stock price forecast for 2026-2027?

The 12 Wall Street analysts covering Woodward, Inc. have a median 12-month price target of $440, with estimates ranging from $415 to $502. These are third-party analyst estimates, not Ticker Nerd forecasts, and they are frequently wrong.

Is WWD stock a buy right now?

Of the 12 analysts covering Woodward, Inc., 10 rate it a Buy, 2 a Hold and 0 a Sell. Ticker Nerd's systematic factor model ranks Woodward, Inc. 85 out of 100 across roughly 4,600 US stocks as at 1 Aug 2026. None of this is personal advice — it does not consider your circumstances.

How does Ticker Nerd's model rank WWD?

As at 1 Aug 2026, Woodward, Inc. ranks 85 out of 100 on Ticker Nerd's systematic factor model — a percentile across roughly 4,600 US stocks, built from its factor families. Its strongest factor family is Quality (96 of 100).

Will WWD stock go up?

No one can know that. What the data says: the median 12-month target from 12 analysts implies +21.0% from the last close, and Ticker Nerd's factor model ranks Woodward, Inc. 85 out of 100 as at 1 Aug 2026. Analyst targets are third-party estimates and frequently wrong; none of this is personal advice.

What is the WWD stock forecast for 2030?

No analyst covering Woodward, Inc. publishes a 2030 price target — Wall Street targets run 12 to 18 months out. Sites quoting a 2030 price for WWD are extrapolating price history, which says nothing about the business. The furthest attributed numbers are the current analyst targets: $415 to $502 over the next 12 months.

How has WWD stock performed over the past year?

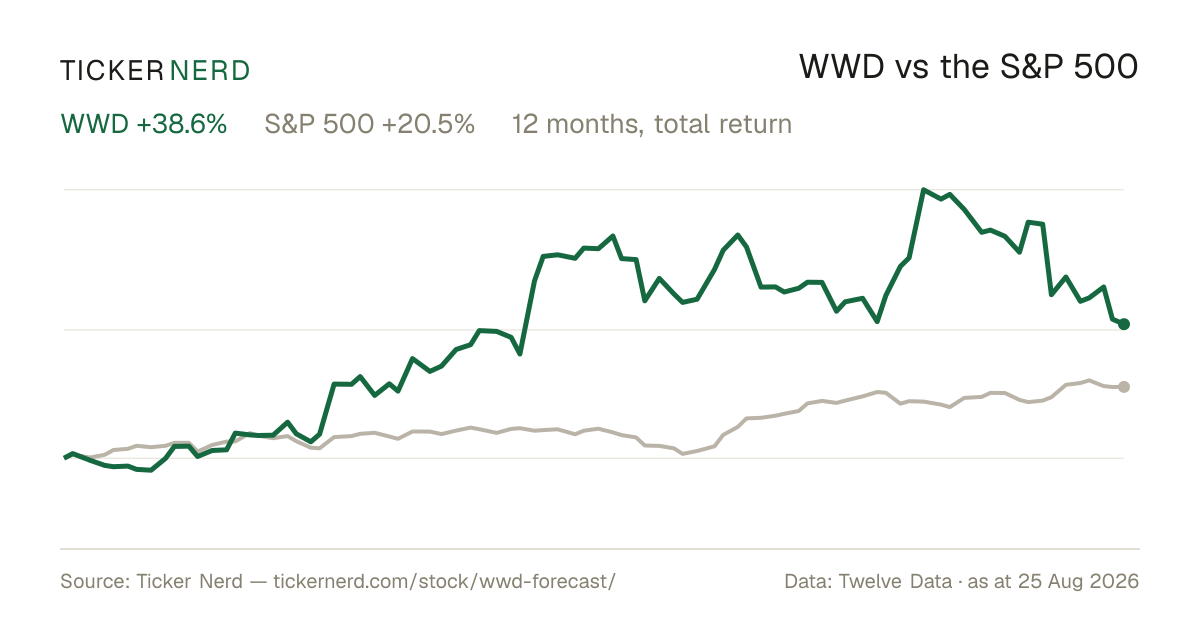
Woodward, Inc. returned +40.8% over the 12 months to 3 Aug 2026, with dividends reinvested. Past performance does not indicate future returns.

What does Woodward, Inc. do?

Woodward Inc. is an American designer, manufacturer, and service provider of energy conversion and control solutions for aerospace and industrial equipment markets worldwide.

What is the latest news on WWD?

The most recent item we track (Zacks Investment Research, 31 July 2026): "Woodward (WWD) is an Incredible Growth Stock: 3 Reasons Why". Zacks Investment Research published an analysis highlighting Woodward (WWD) as an appealing growth stock, stating the company is well positioned to outperform the market due to above-average growth in its financials.

Company

About Woodward, Inc.

Woodward Inc. is an American designer, manufacturer, and service provider of energy conversion and control solutions for aerospace and industrial equipment markets worldwide. The company focuses on control systems and components that manage fluid, combustion, electrical, propulsion, and motion energy in demanding environments such as aircraft, power plants, marine vessels, refineries, data centers, and mining operations. Woodward operates through two main business segments, Aerospace and Industrial, delivering products like fuel systems, valves, actuators, pumps, electronic controls, and complete control systems for aircraft engines, gas and diesel engines, turbines, compressors, and power-generation equipment. Its technologies are widely used by original equipment manufacturers and prime contractors to improve efficiency, reliability, and emissions performance of critical equipment. Woodward also provides extensive aftermarket services, including repair, maintenance, and replacement of installed products. Serving customers across North America, Europe, and Asia-Pacific, Woodward is headquartered in Fort Collins, Colorado, and today plays a significant role in supporting global aerospace, power generation, transportation, and process industries through specialized control solutions.

CEO Mr. Charles P. Blankenship Jr. · 10,200 employees · United States · https://www.woodward.com