WXMIndustrials · Industrial Distribution

WXM Stock Forecast: WF International Ltd. (China) Price Predictions for 2026-2027

Last close, 11 Nov 2026
$2.46
+10.81% on the day

Ticker Nerd's systematic factor model, run across ~4,600 US stocks, ranks it 8 of 100 as at 11 Nov 2026 — in the weakest quartile.

Market cap
$7.7M
Ticker Nerd rank
8/ 100
Median analyst target
—
Analysts covering
—
Total return, dividends reinvested
1W
+18.3%
1M
−28.0%
YTD
−51.8%
1Y
−63.2%
From 52W high
−68.9%
From 52W low
+32.3%
$1.86
$7.90
52-week range, adjusted closes · the dot is the last close
Ticker Nerd rank

WXM stock analysis: one number for the whole business

Consensus tells you what everyone already believes. The model scores WF International Ltd. (China) on its factor families — the same systematic rank behind the Ticker Nerd portfolio.

Where the model ranks itAs at 11 Nov 2026
8/ 100

Percentile across ~4,600 US stocks on Ticker Nerd’s systematic factor model. Higher is better. How the model is built and tested

Size
87
Accruals
42
Value
35
Volatility
28
Momentum
27
Revisions
25
Quality
12
Issuance
7
Growth
5

Size (87): Smaller than most of the companies we track.

Growth (5): Sales and profits are flat, shrinking, or growing more slowly than they were.

Built and run by Aslam Ghouse, an ex-Goldman Sachs systematic trader with 15+ years in markets.

Wall Street

WXM stock forecast 2026-2027: analyst price targets & predictions

The bullish and bearish analyst opinions on WXM, reported as data — targets and ratings, the market's view beside the model's.

Share price and the analyst range, 12 monthsAdjusted close, US dollars
$2.00$3.00$4.00$5.00$6.00$7.00Jan 26Apr 26Jul 26Oct 26WXM

Price targets and ratings are third-party analyst estimates, reported here as data. They are not Ticker Nerd forecasts, and they are frequently wrong.

Data provided by Twelve Data

Price targets and ratings are third-party analyst estimates, reported here as data. They are not Ticker Nerd forecasts, and they are frequently wrong.

Market Radar

This page is one stock. Monday covers all of them.

WXM appears in the Radar on the weeks it earns a place.

  • Market Radar, every Monday: the week's biggest rank moves across ~4,600 US stocks, and the reason for each.
  • The AI build-out map, free: every AI company we track on one page, with the model's Top picks in all four parts.

Free. Unsubscribe any time.

The AI build-out map
PDF
  • AI cloud capacity

    MSFTAMZNGOOGLORCL

  • AI chips

    NVDAAVGOAMDMU

  • AI networking and servers

    ANETDELLLITECRDO

  • Data centre power

    VRTCEGGEVVST

Performance

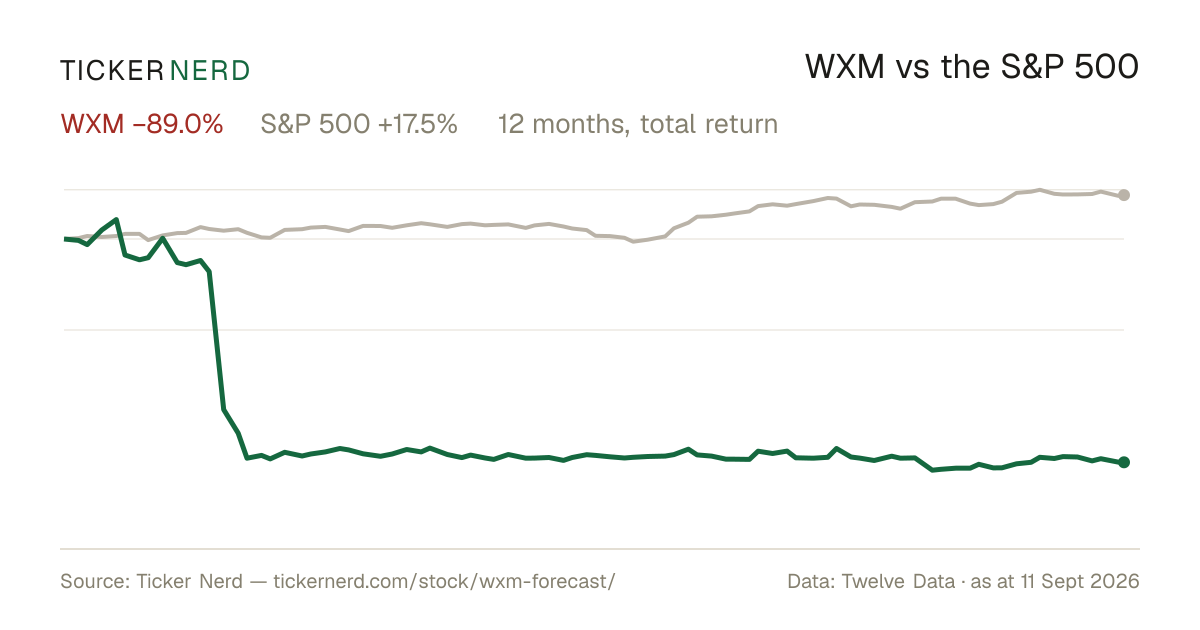
WXM vs the S&P 500

Both lines are total return — dividends reinvested — so the comparison is honest on both sides.

Over the twelve months to 11 Nov 2026, WF International Ltd. (China) returned −63.2% against +12.4% for the S&P 500, dividends included.

WXM vs S&P 500, last 12 monthsTotal return, rebased to 100
20406080100120Jan 26Apr 26Jul 26Oct 26WXMS&P 500

Download this chart as an image — free to reuse; link this page as the source.

Data provided by Twelve Data

Estimates

WXM analyst estimate revisions

Not the forecast itself — the direction analysts are revising it. Revision direction is one of the model's factor families.

Fundamentals

WF International Ltd. (China) (WXM) financial data

A margin means little on its own. Each bar marks where the figure sits across the whole US universe we score.

Valuation
Trailing P/E
18.1×

Cheaper than 40% of US stocks

Price / sales
1.1×

Cheaper than 66% of US stocks

Price / book
0.4×

Cheaper than 84% of US stocks

EV / EBITDA
−0.3×

Cheaper than 65% of US stocks

Growth & margins
Revenue growth (YoY)
−73.4%

Higher than 3% of US stocks

Earnings growth (YoY)
—
Gross margin
14.2%

Higher than 13% of US stocks

Operating margin
−71.0%

Higher than 15% of US stocks

Net margin
−77.4%

Higher than 7% of US stocks

Returns & dividend
Return on equity
−109.7%

Higher than 12% of US stocks

Return on assets
−23.6%

Higher than 17% of US stocks

Dividend yield
0.0%

Higher than 1% of US dividend payers

Bars mark the percentile across the ~4,600 US stocks Ticker Nerd covers, among those reporting the figure.

Key statistics

WF International Ltd. (China) (WXM) statistics: revenue, profit & scale

The headline figures, each with its date. Every row carries its own link — cite it straight from here.

  • WF International Ltd. (China) has a market value of $7.7M and an enterprise value of $1.4M.

  • Shares outstanding: 1.0M.

  • Trailing P/E: 18.1×.

  • Forward dividend yield: 0.00%, paying out 0% of earnings.

  • WF International Ltd. (China) employs 28 people.

market figures as at 12 Nov 2026

Data provided by Twelve Data

Peers

WXM vs competitors

The nearest names by industry and size, scored by the same model — like for like.

Its peer group, ranked by the same modelIndustrial Distribution
CompanyMarket capTKN rank
WXMWF International Ltd. (China)$7.7M8
TLIHTen-League International Holdings Ltd.$17.2M70
WATRAir Water Ventures Ltd.$49.0M17
ALTGAlta Equipment Group, Inc.$178.6M69
EVIEVI Industries, Inc.$297.6M77
TRSGTungray Technologies, Inc.*$20.1M7
TOMZTOMI Environmental Solutions, Inc.*$20.5M71

* Nearest Industrials names by size — few industrial distribution companies of this scale trade in the US universe.

Look up any of the roughly 4,600 stocks we score.

The rank is the raw material. Whether the rules would actually own WF International Ltd. (China) — and when they’d sell — is the membership. See the Ticker Nerd 20 →

News

Latest WXM news & analysis

FAQ

Frequently asked questions about WXM stock

How does Ticker Nerd's model rank WXM?

As at 11 Nov 2026, WF International Ltd. (China) ranks 8 out of 100 on Ticker Nerd's systematic factor model — a percentile across roughly 4,600 US stocks, built from its factor families. Its strongest factor family is Size (87 of 100).

What is the WXM stock forecast for 2030?

No analyst covering WF International Ltd. (China) publishes a 2030 price target — Wall Street targets run 12 to 18 months out. Sites quoting a 2030 price for WXM are extrapolating price history, which says nothing about the business.

How has WXM stock performed over the past year?

WF International Ltd. (China) returned -63.2% over the 12 months to 11 Nov 2026, with dividends reinvested. Past performance does not indicate future returns.

What does WF International Ltd. (China) do?

WF International Limited Ordinary Shares is the equity security of WF International Limited, a China-based company that provides integrated electromechanical solutions. Its current business centers on the supply, installation, fitting-out, and maintenance of HVAC systems, floor heating systems, and water purification systems.

What is the latest news on WXM?

The most recent item we track (Business Wire, 24 July 2026): "CI Global Asset Management Announces Special Reinvested Distribution for CI Morningstar Canada Momentum Index ETF (WXM)". CI Global Asset Management announced a special reinvested distribution for the CI Morningstar Canada Momentum Index ETF (TSX: WXM).

Company

About WF International Ltd. (China).

WF International Limited Ordinary Shares is the equity security of WF International Limited, a China-based company that provides integrated electromechanical solutions. Its current business centers on the supply, installation, fitting-out, and maintenance of HVAC systems, floor heating systems, and water purification systems. The company serves commercial and industrial clients involved in offices, hotels, manufacturing facilities, airports, hospitals, and other large-scale building projects. Through its operating subsidiaries, WF International supports building infrastructure projects that require coordinated mechanical and environmental systems. The ordinary shares represent ownership in the company’s publicly traded holding structure and are used by market participants to gain exposure to its ongoing operations in building systems and related services. WF International Limited is headquartered in Chengdu, China.

CEO Ms. Ke Chen · 28 employees · China · https://wf.international