ZBAOZBAOFinancial Services · Insurance Brokers

ZBAO Stock Forecast: Zhibao Technology, Inc. Price Predictions for 2026-2027

Last close, 14 Sept 2026
$0.12
−22.82% on the day

Ticker Nerd's systematic factor model, run across ~4,600 US stocks, ranks it 11 of 100 as at 14 Sept 2026 — in the weakest quartile.

Market cap
$5.1M
Ticker Nerd rank
11 / 100
Median analyst target
Analysts covering
0
Total return, dividends reinvested
1W
−30.7%
1M
−49.1%
YTD
−87.2%
1Y
−89.2%
From 52W high
−90.9%
From 52W low
0.0%
$0.12
$1.27
52-week range, adjusted closes · the dot is the last close
Ticker Nerd rank

ZBAO stock analysis: one number for the whole business

Consensus tells you what everyone already believes. The model scores Zhibao Technology, Inc. on its factor families — the same systematic rank behind the Ticker Nerd portfolio.

Where the model ranks itAs at 14 Sept 2026
11 / 100

Percentile across ~4,600 US stocks on Ticker Nerd’s systematic factor model. Higher is better. How the model is built and tested

Size
95
Accruals
50
Growth
38
Issuance
35
Revisions
25
Momentum
23
Value
9
Volatility
3
Quality
2

Size (95): Smaller than most of the companies we track.

Quality (2): Profits are thin or unreliable for the size of the business, or they are not turning into cash.

Built and run by Aslam Ghouse, an ex-Goldman Sachs quant trader with fourteen years in markets.

Wall Street

ZBAO stock forecast 2026-2027: analyst price targets & predictions

The bullish and bearish analyst opinions on ZBAO, reported as data — targets and ratings, the market's view beside the model's.

Share price and the analyst range, 12 monthsAdjusted close, US dollars
$0.00$0.20$0.40$0.60$0.80$1.00$1.20Oct 25Jan 26Apr 26Jul 26ZBAO

Price targets and ratings are third-party analyst estimates, reported here as data. They are not Ticker Nerd forecasts, and they are frequently wrong.

Data provided by Twelve Data

Price targets and ratings are third-party analyst estimates, reported here as data. They are not Ticker Nerd forecasts, and they are frequently wrong.

Market Radar

This page is one stock. Monday covers all of them.

Computed off the Friday close and sent before the US open.

Market Radar reports the week’s largest rank changes across roughly 4,600 US stocks, the factor behind each one, and where the market went. ZBAO appears on the weeks it earns a place.

Free, every Monday. Unsubscribe any time.

Performance

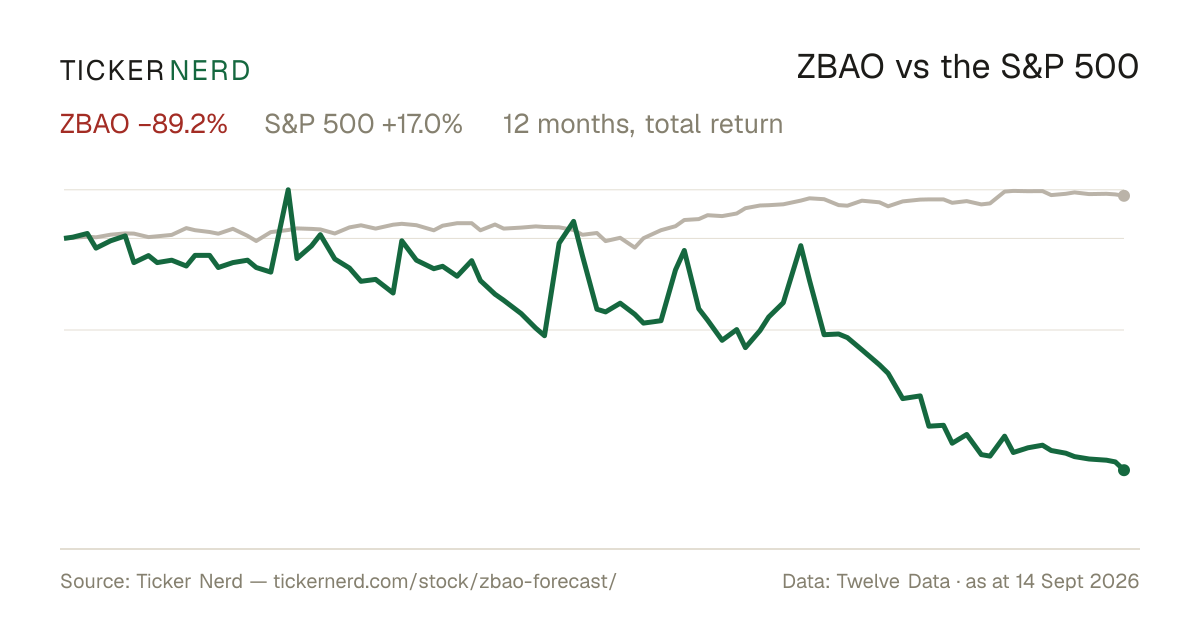
ZBAO vs the S&P 500

Both lines are total return — dividends reinvested — so the comparison is honest on both sides.

Over the twelve months to 14 Sept 2026, Zhibao Technology, Inc. returned −89.2% against +17.0% for the S&P 500, dividends included.

ZBAO vs S&P 500, last 12 monthsTotal return, rebased to 100
020406080100120Oct 25Jan 26Apr 26Jul 26ZBAOS&P 500

Download this chart as an image — free to reuse; link this page as the source.

Data provided by Twelve Data

Estimates

ZBAO analyst estimate revisions

Not the forecast itself — the direction analysts are revising it. Revision direction is one of the model's factor families.

Fundamentals

Zhibao Technology, Inc. (ZBAO) financial data

A margin means little on its own. Each bar marks where the figure sits across the whole US universe we score.

Valuation
Trailing P/E
11.7×

Cheaper than 54% of US stocks

Price / sales
0.0×

Cheaper than 99% of US stocks

Price / book
1.7×

Cheaper than 52% of US stocks

EV / EBITDA
−1.2×

Cheaper than 68% of US stocks

Growth & margins
Revenue growth (YoY)
40.7%

Higher than 83% of US stocks

Earnings growth (YoY)
Gross margin
Operating margin
2.2%

Higher than 49% of US stocks

Net margin
−19.5%

Higher than 16% of US stocks

Returns & dividend
Return on equity
−99.7%

Higher than 13% of US stocks

Return on assets
−11.0%

Higher than 26% of US stocks

Dividend yield

Bars mark the percentile across the ~4,600 US stocks Ticker Nerd covers, among those reporting the figure.

Key statistics

Zhibao Technology, Inc. (ZBAO) statistics: revenue, profit & scale

The headline figures, each with its date. Every row carries its own link — cite it straight from here.

  • Zhibao Technology, Inc. has a market value of $5.1M and an enterprise value of $9.2M.

  • Shares outstanding: 33.0M.

  • Trailing P/E: 11.7×.

  • Zhibao Technology, Inc. employs 137 people.

market figures as at 14 Sept 2026

Data provided by Twelve Data

Peers

ZBAO vs competitors

The nearest names by industry and size, scored by the same model — like for like.

Its peer group, ranked by the same modelInsurance Brokers
CompanyMarket capTKN rank
ZBAOZhibao Technology, Inc.$5.1M
11
EZRAReliance Global Group, Inc.$4.6M
31
EHTHeHealth, Inc.$28.7M
25
AIFUAIFU, Inc.$65.5M
26
SLQTSelectQuote, Inc.$88.2M
42
CWDCaliberCos, Inc.*$5.3M
19
DPUTop KingWin Ltd.*$5.3M
61

* Nearest Financial Services names by size — few insurance brokers companies of this scale trade in the US universe.

Look up any of the roughly 4,600 stocks we score.

The rank is the raw material. Whether the rules would actually own Zhibao Technology, Inc. — and when they’d sell — is the membership. See the Ticker Nerd 20 →

News

Latest ZBAO news & analysis

Zhibao Technology Inc. Announces Closing of $154.7 Million PIPE Financing

Newsfile Corp · 17 Aug 2026positive

Zhibao Technology Inc. announced the closing of its previously announced private investment in public equity (PIPE) financing, raising an aggregate $154.7 million through the sale of 442 million PIPE Units at $0.35 per unit, each consisting of one Class A Ordinary Share and one two-year warrant. Some 395.7 million units were delivered at closing, with the remaining 46.3 million units to be delivered following shareholder approval.

Why it matters — The completion of this substantial PIPE financing provides Zhibao with significant new capital and a simplified unit structure, which shareholders may track as it may affect the company's share count and funding position.

FAQ

Frequently asked questions about ZBAO stock

How does Ticker Nerd's model rank ZBAO?

As at 14 Sept 2026, Zhibao Technology, Inc. ranks 11 out of 100 on Ticker Nerd's systematic factor model — a percentile across roughly 4,600 US stocks, built from its factor families. Its strongest factor family is Size (95 of 100).

What is the ZBAO stock forecast for 2030?

No analyst covering Zhibao Technology, Inc. publishes a 2030 price target — Wall Street targets run 12 to 18 months out. Sites quoting a 2030 price for ZBAO are extrapolating price history, which says nothing about the business.

How has ZBAO stock performed over the past year?

Zhibao Technology, Inc. returned -89.2% over the 12 months to 14 Sept 2026, with dividends reinvested. Past performance does not indicate future returns.

What does Zhibao Technology, Inc. do?

Zhibao Technology Inc. Class A Ordinary Shares represent the equity of Zhibao Technology Inc., an InsurTech company focused on digital insurance brokerage services in China.

What is the latest news on ZBAO?

The most recent item we track (Newsfile Corp, 17 Aug 2026): "Zhibao Technology Inc. Announces Closing of $154.7 Million PIPE Financing". Zhibao Technology Inc. announced the closing of its previously announced private investment in public equity (PIPE) financing, raising an aggregate $154.7 million through the sale of 442 million PIPE Units at $0.35 per unit, each consisting of one Class A Ordinary Share and one two-year warrant. Some 395.7 million units were delivered at closing, with the remaining 46.3 million units to be delivered following shareholder approval.

Company

About Zhibao Technology, Inc.

Zhibao Technology Inc. Class A Ordinary Shares represent the equity of Zhibao Technology Inc., an InsurTech company focused on digital insurance brokerage services in China. The company also provides managing general underwriting services, healthcare-related insurance solutions, and offline insurance brokerage consulting through its operating entities. Its business is centered on technology-enabled distribution and administration of insurance products, serving a market where digital channels are increasingly important for reaching customers and partners. Zhibao Technology Inc. operates from Shanghai, China, and its ordinary shares reflect exposure to a financial services business that combines insurance brokerage expertise with digital infrastructure and embedded insurance models. The company’s role in the market is to connect insurers, business partners, and end users through streamlined insurance solutions tailored to the Chinese insurance ecosystem.

CEO Ms. Jinmei Guo Hellstroem · 137 employees · China · https://www.zhibao-tech.com