AWIAWIIndustrials · Building Products & Equipment

AWI Stock Forecast: Armstrong World Industries, Inc. Price Predictions for 2026-2027

Last close, 14 Aug 2026
$182
+0.29% on the day

The 9 Wall Street analysts covering Armstrong World Industries, Inc. hold a median 12-month price target of $209 — +14.4% from the last close. Ticker Nerd's systematic factor model, run across ~4,600 US stocks, ranks it 63 of 100 as at 13 Aug 2026 — in the upper half.

Market cap
$7.7B
Ticker Nerd rank
63 / 100
Median analyst target
$209
Analysts covering
9
Total return, dividends reinvested
1W
−1.8%
1M
+17.4%
YTD
−4.1%
1Y
−5.4%
From 52W high
−9.9%
From 52W low
+20.5%
$151
$202
52-week range, adjusted closes · the dot is the last close
Ticker Nerd rank

AWI stock analysis: one number for the whole business

Consensus tells you what everyone already believes. The model scores Armstrong World Industries, Inc. on its factor families — the same systematic rank behind the Ticker Nerd portfolio.

Where the model ranks itAs at 13 Aug 2026
63 / 100

Percentile across ~4,600 US stocks on Ticker Nerd’s systematic factor model. Higher is better. How the model is built and tested

Quality
97
Volatility
94
Revisions
80
Issuance
70
Momentum
49
Growth
40
Value
35
Accruals
34
Size
18

Quality (97): The business earns solid, repeatable profits on what it owns.

Accruals (34): A large share of reported profit has not shown up as cash, or the balance sheet is expanding quickly — both tend to unwind.

Size (18): Larger than most of the companies we track — more scrutinised, less often mispriced.

Built and run by Aslam Ghouse, an ex-Goldman Sachs quant trader with fourteen years in markets.

Wall Street

AWI stock forecast 2026-2027: analyst price targets & predictions

The bullish and bearish analyst opinions on AWI, reported as data — targets and ratings, the market's view beside the model's.

Share price and the analyst range, 12 monthsAdjusted close, US dollars
$140$160$180$200$220$240Oct 25Jan 26Apr 26Jul 26AWIHigh $230Median $209Low $190

Price targets and ratings are third-party analyst estimates, reported here as data. They are not Ticker Nerd forecasts, and they are frequently wrong.

What Wall Street says9 analysts
6 Buy3 Hold0 Sell
Low $190Median $209High $230

The green dot is the last close — the median target sits +14.4% from it.

Recent analyst actionsNewest first
DateFirmActionRatingTarget
29 Apr 2026Evercore ISI GroupUpgradeOutperform$203$200
29 Apr 2026Evercore ISI GroupUpgradeOutperform
29 Apr 2026UBSMaintainsNeutral$200$195
29 Apr 2026UBSMaintainsNeutral
20 Apr 2026B of A SecuritiesMaintainsBuy
13 Apr 2026Evercore ISI GroupMaintainsIn-Line
25 Feb 2026Evercore ISI GroupMaintainsIn-Line
29 Oct 2025JP MorganMaintainsOverweight
29 Oct 2025UBSMaintainsNeutral
6 Oct 2025B of A SecuritiesMaintainsBuy
12 Sept 2025Truist SecuritiesMaintainsBuy
30 July 2025Evercore ISI GroupMaintainsIn-Line
30 July 2025Loop CapitalMaintainsHold
30 July 2025Truist SecuritiesMaintainsBuy
30 July 2025UBSMaintainsNeutral
24 June 2025JP MorganInitiatesOverweight
15 May 2025B of A SecuritiesMaintainsBuy
30 Apr 2025B of A SecuritiesMaintainsBuy
30 Apr 2025Loop CapitalMaintainsHold
21 Apr 2025B of A SecuritiesMaintainsBuy

Price targets and ratings are third-party analyst estimates, reported here as data. They are not Ticker Nerd forecasts, and they are frequently wrong.

Market Radar

This page is one stock. Monday covers all of them.

Computed off the Friday close and sent before the US open.

Market Radar reports the week’s largest rank changes across roughly 4,600 US stocks, the factor behind each one, and where the market went. AWI appears on the weeks it earns a place.

Free, every Monday. Unsubscribe any time.

Estimates

AWI analyst estimate revisions

Not the forecast itself — the direction analysts are revising it. Revision direction is one of the model's factor families.

Which way the estimates are movingNext fiscal year
EPS revision, 90 days
+1.5%
Analysts raising
0
Analysts cutting
1
Fundamentals

Armstrong World Industries, Inc. (AWI) financial data

A margin means little on its own. Each bar marks where the figure sits across the whole US universe we score.

Valuation
Trailing P/E
24.9×

Cheaper than 32% of US stocks

Price / sales
4.5×

Cheaper than 28% of US stocks

Price / book
8.7×

Cheaper than 12% of US stocks

EV / EBITDA
18.2×

Cheaper than 18% of US stocks

Growth & margins
Revenue growth (YoY)
11.2%

Higher than 56% of US stocks

Earnings growth (YoY)
10.1%

Higher than 48% of US stocks

Gross margin
41.3%

Higher than 52% of US stocks

Operating margin
21.6%

Higher than 81% of US stocks

Net margin
18.6%

Higher than 81% of US stocks

Returns & dividend
Return on equity
36.6%

Higher than 90% of US stocks

Return on assets
10.6%

Higher than 93% of US stocks

Dividend yield
0.7%

Higher than 16% of US dividend payers

Bars mark the percentile across the ~4,600 US stocks Ticker Nerd covers, among those reporting the figure.

Peers

AWI vs competitors

The nearest names by industry and size, scored by the same model — like for like.

Its peer group, ranked by the same modelBuilding Products & Equipment
CompanyMarket capTKN rank
AWIArmstrong World Industries, Inc.$7.7B
63
BLDRBuilders FirstSource, Inc.$8.1B
37
AAONAAON, Inc.$7.1B
41
SPXCSPX Technologies, Inc.$10.5B
76
FBINFortune Brands Innovations, Inc.$5.8B
46
WMSAdvanced Drainage Systems, Inc.$11.6B
50
LPXLouisiana-Pacific Corp.$5.2B
18

Look up any of the roughly 4,600 stocks we score.

The rank is the raw material. Whether the rules would actually own Armstrong World Industries, Inc. — and when they’d sell — is the membership. See the Ticker Nerd 20 →

News

Latest AWI news & analysis

Dividend Champion, Contender, And Challenger Highlights: Week August 16

Seeking Alpha · 14 Aug 2026neutral

A weekly summary of dividend activity for Dividend Champions, Contenders, and Challengers was published, noting companies that changed their dividends and those with upcoming ex-dividend dates.

Why it matters — AWI watchers would be interested as Armstrong World Industries may be included among the companies reviewed for dividend changes or ex-dividend dates.

Touchstone Mid Cap Fund Q2 2026 Portfolio Review

Seeking Alpha · 13 Aug 2026negative

The Touchstone Mid Cap Fund's Q2 2026 portfolio review notes the fund underperformed the Russell MidCap Index for the quarter ending June 30, 2026. Armstrong World Industries, Inc. is listed among the fund's largest detractors from performance, along with Domino's Pizza and Allison Transmission Holdings.

Why it matters — This report identifies Armstrong World Industries as a notable underperformer within a major mid-cap fund's holdings during the quarter, offering a signal about how the stock performed relative to the broader market.

Armstrong World Industries: Growth Initiatives Are Positive, Reiterate Buy

Seeking Alpha · 10 Aug 2026positive

Seeking Alpha reiterates a buy rating on Armstrong World Industries, citing positive Mineral Fiber volume, strong Architectural Specialties growth, and improving office activity. Q2 revenue rose 11.2% year over year to $472M, and management raised FY2026 revenue guidance to $1.77–$1.80B, though margin pressure persists from recent acquisitions. Growth initiatives Kanopi and ProjectWorks are gaining traction.

Why it matters — AWI watchers would care because the report highlights stronger growth and raised revenue guidance, underpinned by traction in the Kanopi and ProjectWorks initiatives, even as acquisition-related margin pressure continues.

Armstrong World Industries Appoints Jennifer Kozak to Senior Vice President, Chief Human Resources Officer

Business Wire · 30 July 2026neutral

Armstrong World Industries announced the appointment of Jennifer Kozak as Senior Vice President, Chief Human Resources Officer and a member of the Executive Leadership Team, effective Sept. 9, 2026.

Why it matters — AWI watchers would note the addition of a new executive to the leadership team responsible for the company's human resources strategy as it continues to evolve and grow.

Armstrong World Industries (AWI) Upgraded to Buy: Here's What You Should Know

Zacks Investment Research · 29 July 2026positive

Armstrong World Industries (AWI) was upgraded to a Zacks Rank #2 (Buy), reflecting growing optimism about the company's earnings prospects.

Why it matters — An upgrade based on earnings prospects signals a shift in analyst sentiment that AWI watchers would want to note.

FAQ

Frequently asked questions about AWI stock

What is the AWI stock price forecast for 2026-2027?

The 9 Wall Street analysts covering Armstrong World Industries, Inc. have a median 12-month price target of $209, with estimates ranging from $190 to $230. These are third-party analyst estimates, not Ticker Nerd forecasts, and they are frequently wrong.

Is AWI stock a buy right now?

Of the 9 analysts covering Armstrong World Industries, Inc., 6 rate it a Buy, 3 a Hold and 0 a Sell. Ticker Nerd's systematic factor model ranks Armstrong World Industries, Inc. 63 out of 100 across roughly 4,600 US stocks as at 13 Aug 2026. None of this is personal advice — it does not consider your circumstances.

How does Ticker Nerd's model rank AWI?

As at 13 Aug 2026, Armstrong World Industries, Inc. ranks 63 out of 100 on Ticker Nerd's systematic factor model — a percentile across roughly 4,600 US stocks, built from its factor families. Its strongest factor family is Quality (97 of 100).

Will AWI stock go up?

No one can know that. What the data says: the median 12-month target from 9 analysts implies +14.4% from the last close, and Ticker Nerd's factor model ranks Armstrong World Industries, Inc. 63 out of 100 as at 13 Aug 2026. Analyst targets are third-party estimates and frequently wrong; none of this is personal advice.

What is the AWI stock forecast for 2030?

No analyst covering Armstrong World Industries, Inc. publishes a 2030 price target — Wall Street targets run 12 to 18 months out. Sites quoting a 2030 price for AWI are extrapolating price history, which says nothing about the business. The furthest attributed numbers are the current analyst targets: $190 to $230 over the next 12 months.

How has AWI stock performed over the past year?

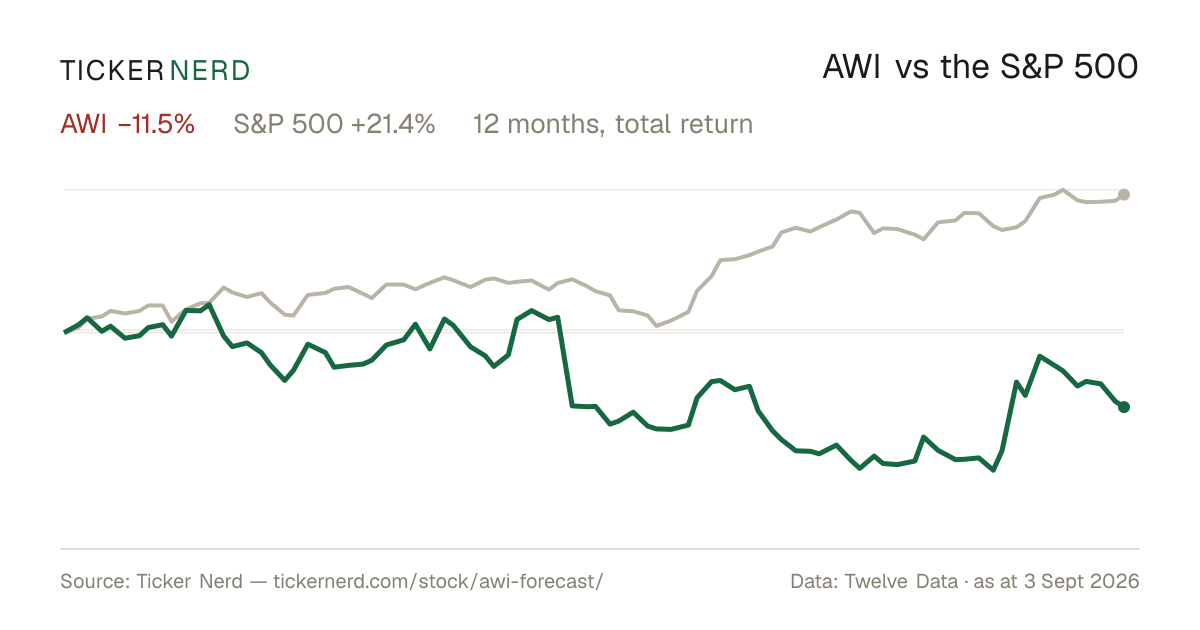
Armstrong World Industries, Inc. returned -5.4% over the 12 months to 14 Aug 2026, with dividends reinvested. Past performance does not indicate future returns.

What does Armstrong World Industries, Inc. do?

Armstrong World Industries, Inc. is an established leader in the production and design of commercial and residential ceiling, wall, and suspension systems.

What is the latest news on AWI?

The most recent item we track (Seeking Alpha, 14 Aug 2026): "Dividend Champion, Contender, And Challenger Highlights: Week August 16". A weekly summary of dividend activity for Dividend Champions, Contenders, and Challengers was published, noting companies that changed their dividends and those with upcoming ex-dividend dates.

Company

About Armstrong World Industries, Inc.

Armstrong World Industries, Inc. is an established leader in the production and design of commercial and residential ceiling, wall, and suspension systems. Its core function is to provide innovative interior solutions that enhance spaces with improved acoustical performance and aesthetic appeal. The company's products serve key sectors, including healthcare, education, commercial, and residential construction, reflecting the broad impact it has across industries that require efficient and effective building materials. By offering sustainable, durable, and designer-friendly options, Armstrong World Industries integrates both functionality and style into its offerings. Headquartered in Lancaster, Pennsylvania, the company remains significant in the market due to its continuous commitment to advancing architectural environments through superior ceiling and wall solutions. Armstrong World Industries also drives industry standards by focusing on sustainability and design flexibility, supporting architects and builders in creating more comfortable and acoustically sound environments.

CEO Mr. Mark A. Hershey J.D. · 4,000 employees · United States · https://www.armstrong.com