BBOTBBOTHealthcare · Biotechnology

BBOT Stock Forecast: Bridgebio Oncology Therapeutics, Inc. Price Predictions for 2026-2027

Last close, 3 Aug 2026
$8.25
+1.98% on the day

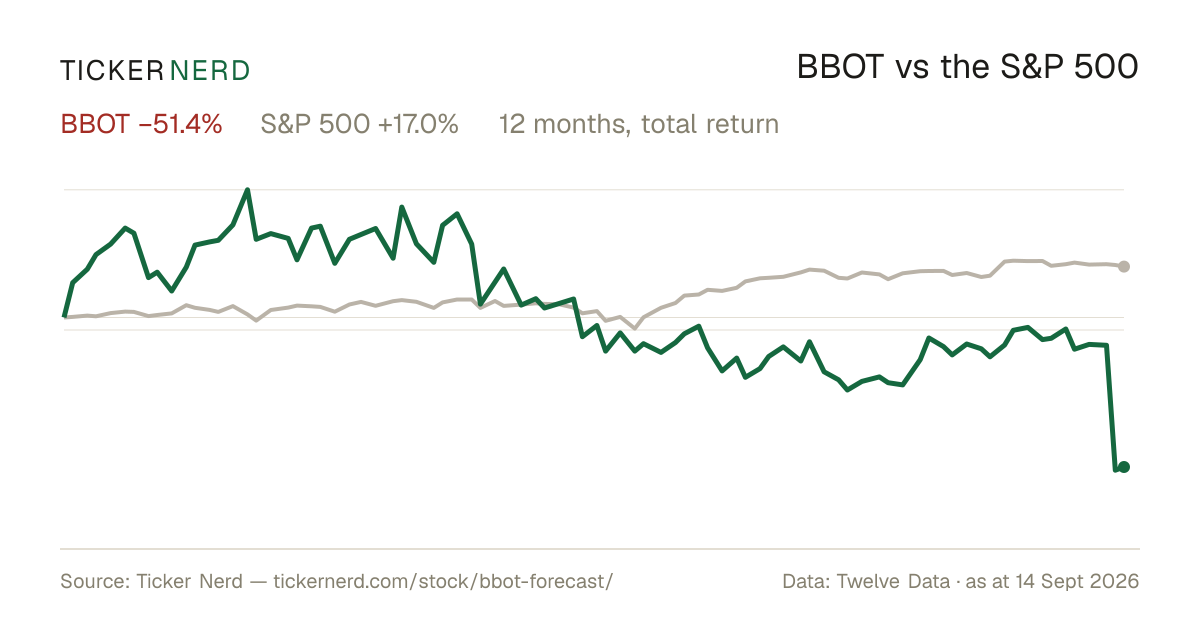
The 11 Wall Street analysts covering Bridgebio Oncology Therapeutics, Inc. hold a median 12-month price target of $24 — +184.8% from the last close. Ticker Nerd's systematic factor model, run across ~4,600 US stocks, ranks it 13 of 100 as at 1 Aug 2026 — in the weakest quartile. The Street sees upside; the factor read is a caution. That gap is the story on this page.

Market cap
$648.1M
Ticker Nerd rank
13 / 100
Median analyst target
$24
Analysts covering
11
Total return, dividends reinvested
1W
−5.7%
1M
+1.7%
YTD
−34.1%
From high
−39.9%
From low
+15.9%
$7
$14
Range since 6 Aug 2025, adjusted closes · the dot is the last close
Ticker Nerd rank

BBOT stock analysis: one number for the whole business

Consensus tells you what everyone already believes. The model scores Bridgebio Oncology Therapeutics, Inc. on its factor families — the same systematic rank behind the Ticker Nerd portfolio.

Where the model ranks itAs at 1 Aug 2026
13 / 100

Percentile across ~4,600 US stocks on Ticker Nerd’s systematic factor model. Higher is better. How the model is built and tested

Volatility
68
Quality
52
Size
50
Value
48
Momentum
31
Revisions
28
Accruals
23
Issuance
14
Growth
9

Volatility (68): The share price has been relatively steady.

Growth (9): Sales and profits are flat, shrinking, or growing more slowly than they were.

The rank is the raw material. Whether the rules would actually own Bridgebio Oncology Therapeutics, Inc. — and when they’d sell — is the membership.

Wall Street

BBOT stock forecast 2026-2027: analyst price targets & predictions

The bullish and bearish analyst opinions on BBOT, reported as data — targets and ratings, the market's view beside the model's.

Share price and the analyst range, since 6 Aug 2025Adjusted close, US dollars
$10$20$30$40Oct 25Jan 26Apr 26Jul 26BBOTHigh $41Median $24Low $18

Price targets and ratings are third-party analyst estimates, reported here as data. They are not Ticker Nerd forecasts, and they are frequently wrong.

What Wall Street says11 analysts
11 Buy0 Hold0 Sell
Low $18Median $24High $41

The green dot is the last close — the median target sits +184.8% from it.

Recent analyst actionsNewest first
DateFirmActionRatingTarget
8 July 2026JP MorganInitiatesOverweight$27
8 July 2026JP MorganInitiatesOverweight
22 June 2026OppenheimerAssumesOutperform$22
11 May 2026Canaccord GenuityInitiatesBuy
6 Mar 2026HC Wainwright & Co.MaintainsBuy
11 Feb 2026StifelInitiatesBuy
9 Jan 2026Raymond JamesInitiatesOutperform
11 Dec 2025WedbushReiteratesOutperform
5 Dec 2025Morgan StanleyInitiatesOverweight
25 Nov 2025WedbushReiteratesOutperform
13 Nov 2025OppenheimerMaintainsOutperform
17 Sept 2025Leerink PartnersInitiatesOutperform
15 Sept 2025HC Wainwright & Co.InitiatesBuy
4 Sept 2025OppenheimerInitiatesOutperform
18 Aug 2025WedbushInitiatesOutperform

Price targets and ratings are third-party analyst estimates, reported here as data. They are not Ticker Nerd forecasts, and they are frequently wrong.

Estimates

BBOT analyst estimate revisions

Not the forecast itself — the direction analysts are revising it. Revision direction is one of the model's factor families.

Which way the estimates are movingNext fiscal year
Analysts raising
0
Analysts cutting
1
Fundamentals

Bridgebio Oncology Therapeutics, Inc. (BBOT) financial data

A margin means little on its own. Each bar marks where the figure sits across the whole US universe we score.

Valuation
Trailing P/E
−1.9×

Cheaper than 84% of US stocks

Price / sales
Price / book
1.8×

Cheaper than 49% of US stocks

EV / EBITDA
−2.4×

Cheaper than 73% of US stocks

Growth & margins
Revenue growth (YoY)
Earnings growth (YoY)
Gross margin
Operating margin
0.0%

Higher than 35% of US stocks

Net margin
0.0%

Higher than 30% of US stocks

Returns & dividend
Return on equity
−62.2%

Higher than 18% of US stocks

Return on assets
−37.2%

Higher than 11% of US stocks

Dividend yield

Bars mark the percentile across the ~4,600 US stocks Ticker Nerd covers, among those reporting the figure.

Peers

BBOT vs competitors

The nearest names by industry and size, scored by the same model — like for like.

Its peer group, ranked by the same modelBiotechnology
CompanyMarket capTKN rank
BBOTBridgebio Oncology Therapeutics, Inc.$648.1M
13
GYREGyre Therapeutics, Inc.$641.1M
59
STTKShattuck Labs, Inc.$638.9M
78
NGNENeurogene, Inc.$634.8M
62
RGNXREGENXBIO, Inc.$632.9M
30
ACHVAchieve Life Sciences, Inc.$659.1M
39
ALLOAllogene Therapeutics, Inc.$622.8M
84
Market Radar

This page is one stock. Monday covers all of them.

Computed off the Friday close and sent before the US open.

Market Radar reports the week’s largest rank changes across roughly 4,600 US stocks, the factor behind each one, and where the market went. BBOT appears on the weeks it earns a place.

Free, every Monday. Unsubscribe any time.

FAQ

Frequently asked questions about BBOT stock

What is the BBOT stock price forecast for 2026-2027?

The 11 Wall Street analysts covering Bridgebio Oncology Therapeutics, Inc. have a median 12-month price target of $24, with estimates ranging from $18 to $41. These are third-party analyst estimates, not Ticker Nerd forecasts, and they are frequently wrong.

Is BBOT stock a buy right now?

Of the 11 analysts covering Bridgebio Oncology Therapeutics, Inc., 11 rate it a Buy, 0 a Hold and 0 a Sell. Ticker Nerd's systematic factor model ranks Bridgebio Oncology Therapeutics, Inc. 13 out of 100 across roughly 4,600 US stocks as at 1 Aug 2026. None of this is personal advice — it does not consider your circumstances.

How does Ticker Nerd's model rank BBOT?

As at 1 Aug 2026, Bridgebio Oncology Therapeutics, Inc. ranks 13 out of 100 on Ticker Nerd's systematic factor model — a percentile across roughly 4,600 US stocks, built from its factor families. Its strongest factor family is Volatility (68 of 100).

Will BBOT stock go up?

No one can know that. What the data says: the median 12-month target from 11 analysts implies +184.8% from the last close, and Ticker Nerd's factor model ranks Bridgebio Oncology Therapeutics, Inc. 13 out of 100 as at 1 Aug 2026. Analyst targets are third-party estimates and frequently wrong; none of this is personal advice.

What is the BBOT stock forecast for 2030?

No analyst covering Bridgebio Oncology Therapeutics, Inc. publishes a 2030 price target — Wall Street targets run 12 to 18 months out. Sites quoting a 2030 price for BBOT are extrapolating price history, which says nothing about the business. The furthest attributed numbers are the current analyst targets: $18 to $41 over the next 12 months.

What does Bridgebio Oncology Therapeutics, Inc. do?

BridgeBio Oncology Therapeutics is a clinical-stage biopharmaceutical company developing small molecule therapeutics targeting RAS and PI3Kα pathway cancers. The company specializes in precision oncology by creating innovative approaches to address historically difficult-to-drug targets, including direct KRAS inhibitors that bind to both active and inactive protein states, PI3Kα:RAS interaction breakers designed to block specific signaling cascades while minimizing metabolic side effects, and pan-KRAS inhibitors targeting multiple KRAS mutations.

Company

About Bridgebio Oncology Therapeutics, Inc.

BridgeBio Oncology Therapeutics is a clinical-stage biopharmaceutical company developing small molecule therapeutics targeting RAS and PI3Kα pathway cancers. The company specializes in precision oncology by creating innovative approaches to address historically difficult-to-drug targets, including direct KRAS inhibitors that bind to both active and inactive protein states, PI3Kα:RAS interaction breakers designed to block specific signaling cascades while minimizing metabolic side effects, and pan-KRAS inhibitors targeting multiple KRAS mutations. BridgeBio Oncology Therapeutics currently has multiple programs in clinical development, including candidates for non-small cell lung cancer, colorectal cancer, and breast cancer. Originally established as a subsidiary of BridgeBio Pharma in 2016, the company became a standalone public entity in 2025 through a business combination. Based in South San Francisco, BridgeBio Oncology Therapeutics applies advanced understanding of RAS signaling biology to rational drug design, aiming to deliver well-tolerated medicines with greater efficacy and safety for patients with cancers driven by the two most prevalent oncogenes in human tumors.

CEO Mr. Eli M. Wallace Ph.D. · 106 employees · United States · https://bbotx.com