BCGFinancial Services · Asset Management

BCG Stock Forecast: Binah Capital Group, Inc. Price Predictions for 2026-2027

Last close, 24 Aug 2026
$1.46
+4.29% on the day

Ticker Nerd's systematic factor model, run across ~4,600 US stocks, ranks it 78 of 100 as at 22 Aug 2026 — inside the top quartile.

Market cap
$24.9M
Ticker Nerd rank
78 / 100
Median analyst target
Analysts covering
Revenue$47.1M
Operating income$1.9M
Net income$1.9M
Free cash flow$527K
Quarterly, 8 quarters to 31 Mar 2026 · latest quarter's figure shown
Total return, dividends reinvested
1W
−6.4%
1M
+7.4%
YTD
−49.3%
1Y
−27.0%
From 52W high
−53.1%
From 52W low
+11.9%
$1.31
$3.11
52-week range, adjusted closes · the dot is the last close
Ticker Nerd rank

BCG stock analysis: one number for the whole business

Consensus tells you what everyone already believes. The model scores Binah Capital Group, Inc. on its factor families — the same systematic rank behind the Ticker Nerd portfolio.

Where the model ranks itAs at 22 Aug 2026
78 / 100

Percentile across ~4,600 US stocks on Ticker Nerd’s systematic factor model. Higher is better. How the model is built and tested

Quality
98
Size
88
Growth
82
Volatility
78
Value
76
Issuance
61
Momentum
54
Accruals
28
Revisions
25

Quality (98): The business earns solid, repeatable profits on what it owns.

Revisions (25): Analysts have, on balance, been cutting their forecasts.

Built and run by Aslam Ghouse, an ex-Goldman Sachs quant trader with fourteen years in markets.

Wall Street

BCG stock forecast 2026-2027: analyst price targets & predictions

The bullish and bearish analyst opinions on BCG, reported as data — targets and ratings, the market's view beside the model's.

Share price and the analyst range, 12 monthsAdjusted close, US dollars
$1.50$2.00$2.50$3.00Oct 25Jan 26Apr 26Jul 26BCG

Price targets and ratings are third-party analyst estimates, reported here as data. They are not Ticker Nerd forecasts, and they are frequently wrong.

Data provided by Twelve Data

Price targets and ratings are third-party analyst estimates, reported here as data. They are not Ticker Nerd forecasts, and they are frequently wrong.

Market Radar

This page is one stock. Monday covers all of them.

Computed off the Friday close and sent before the US open.

Market Radar reports the week’s largest rank changes across roughly 4,600 US stocks, the factor behind each one, and where the market went. BCG appears on the weeks it earns a place.

Free, every Monday. Unsubscribe any time.

Performance

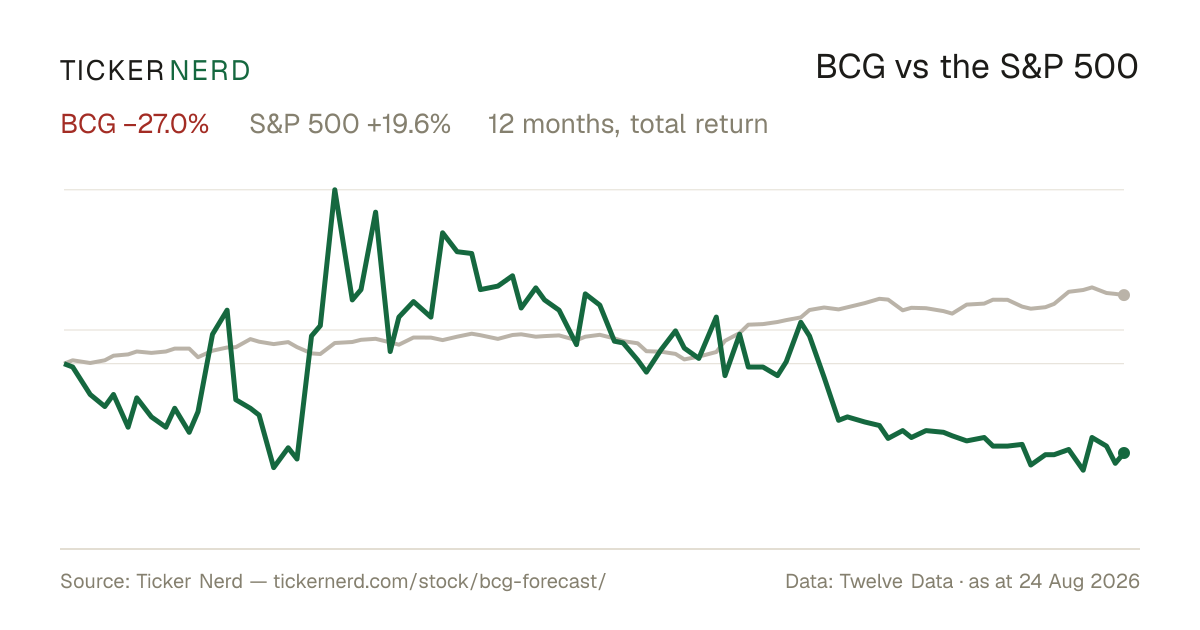
BCG vs the S&P 500

Both lines are total return — dividends reinvested — so the comparison is honest on both sides.

Over the twelve months to 24 Aug 2026, Binah Capital Group, Inc. returned −27.0% against +19.6% for the S&P 500, dividends included.

BCG vs S&P 500, last 12 monthsTotal return, rebased to 100
6080100120140160Oct 25Jan 26Apr 26Jul 26BCGS&P 500

Download this chart as an image — free to reuse; link this page as the source.

Data provided by Twelve Data

Estimates

BCG analyst estimate revisions

Not the forecast itself — the direction analysts are revising it. Revision direction is one of the model's factor families.

Fundamentals

Binah Capital Group, Inc. (BCG) financial data

A margin means little on its own. Each bar marks where the figure sits across the whole US universe we score.

Valuation
Trailing P/E
14.6×

Cheaper than 49% of US stocks

Price / sales
0.1×

Cheaper than 95% of US stocks

Price / book
7.7×

Cheaper than 15% of US stocks

EV / EBITDA
10.6×

Cheaper than 37% of US stocks

Growth & margins
Revenue growth (YoY)
12.3%

Higher than 58% of US stocks

Earnings growth (YoY)
84.0%

Higher than 82% of US stocks

Gross margin
7.7%

Higher than 8% of US stocks

Operating margin
0.9%

Higher than 47% of US stocks

Net margin
2.2%

Higher than 52% of US stocks

Returns & dividend
Return on equity
22.4%

Higher than 84% of US stocks

Return on assets
6.0%

Higher than 81% of US stocks

Dividend yield

Bars mark the percentile across the ~4,600 US stocks Ticker Nerd covers, among those reporting the figure.

Key statistics

Binah Capital Group, Inc. (BCG) statistics: revenue, profit & scale

The headline figures, each with its date. Every row carries its own link — cite it straight from here.

  • Binah Capital Group, Inc. has a market value of $24.9M and an enterprise value of $57.5M.

  • Revenue in the twelve months to 31 Mar 2026: $181.1M. The latest quarter grew 12.3% year on year.

  • Net income over the same four quarters: $3.2M, a 1.8% net margin.

  • Diluted earnings per share, trailing twelve months: $0.16.

  • Free cash flow in the twelve months to 31 Mar 2026: $4.6M, after $64K of capital spending.

  • Binah Capital Group, Inc. spent $835K on dividends in the twelve months to 31 Mar 2026.

  • Shares outstanding: 16.8M.

  • Trailing P/E: 14.6×.

  • Binah Capital Group, Inc. employs 150 people $1.2M of revenue per employee.

Statement figures: company filings via Twelve Data, four quarters to 31 Mar 2026 · market figures as at 25 Aug 2026

Data provided by Twelve Data

Peers

BCG vs competitors

The nearest names by industry and size, scored by the same model — like for like.

Its peer group, ranked by the same modelAsset Management
CompanyMarket capTKN rank
BCGBinah Capital Group, Inc.$24.9M
78
AVATAvalanche Treasury Corp$22.1M
14
BENFBeneficient$34.8M
72
FGNXFG Nexus, Inc.$35.5M
33
MLCIMount Logan Capital, Inc.$37.0M
34
GROWU.S. Global Investors, Inc.$42.1M
97
MGLDThe Marygold Cos, Inc.$42.8M
90

Look up any of the roughly 4,600 stocks we score.

The rank is the raw material. Whether the rules would actually own Binah Capital Group, Inc. — and when they’d sell — is the membership. See the Ticker Nerd 20 →

News

Latest BCG news & analysis

Binah Capital Group Reports Results for Second Quarter of 2026

GlobeNewsWire · 13 Aug 2026positive

Binah Capital Group reported its results for the second quarter and six months ended June 30, 2026. AuM rose 13.4% year-over-year to $31.6 billion, total revenue increased to $46.5 million from $41.5 million, net income improved to $0.3 million from a net loss of $(0.7) million, and EBITDA rose to $1.0 million from $0.1 million in the prior-year period.

Why it matters — A BCG watcher would note the company's transition from a net loss to net income along with growth in AuM, revenue, and EBITDA, signaling continued momentum in its wealth-management business.

Binah Capital Group to Participate in Sidoti Micro-Cap Virtual Conference August 19-20

GlobeNewsWire · 12 Aug 2026neutral

Binah Capital Group announced it will participate in the Sidoti Micro-Cap Virtual Conference on August 19-20, 2026. CEO Craig Gould and CFO David Shane will present on behalf of the company on Thursday, August 20, 2026 at 2:30 PM ET.

Why it matters — The company's senior leadership presenting at a micro-cap investor conference gives BCG watchers an opportunity to hear directly from management about the business.

FAQ

Frequently asked questions about BCG stock

How does Ticker Nerd's model rank BCG?

As at 22 Aug 2026, Binah Capital Group, Inc. ranks 78 out of 100 on Ticker Nerd's systematic factor model — a percentile across roughly 4,600 US stocks, built from its factor families. Its strongest factor family is Quality (98 of 100).

What is the BCG stock forecast for 2030?

No analyst covering Binah Capital Group, Inc. publishes a 2030 price target — Wall Street targets run 12 to 18 months out. Sites quoting a 2030 price for BCG are extrapolating price history, which says nothing about the business.

How has BCG stock performed over the past year?

Binah Capital Group, Inc. returned -27.0% over the 12 months to 24 Aug 2026, with dividends reinvested. Past performance does not indicate future returns.

What does Binah Capital Group, Inc. do?

Binah Capital Group is an independent wealth management enterprise that consolidates and operates a network of broker-dealers, registered investment advisors, and insurance entities across the United States. The company provides financial advisors with access to equity, bond, and exchange-traded fund execution services, along with compliance, research, and accounting support.

What is the latest news on BCG?

The most recent item we track (GlobeNewsWire, 13 Aug 2026): "Binah Capital Group Reports Results for Second Quarter of 2026". Binah Capital Group reported its results for the second quarter and six months ended June 30, 2026. AuM rose 13.4% year-over-year to $31.6 billion, total revenue increased to $46.5 million from $41.5 million, net income improved to $0.3 million from a net loss of $(0.7) million, and EBITDA rose to $1.0 million from $0.1 million in the prior-year period.

Company

About Binah Capital Group, Inc.

Binah Capital Group is an independent wealth management enterprise that consolidates and operates a network of broker-dealers, registered investment advisors, and insurance entities across the United States. The company provides financial advisors with access to equity, bond, and exchange-traded fund execution services, along with compliance, research, and accounting support. Through its subsidiaries, Binah Capital Group offers a comprehensive suite of investment products including mutual funds, alternative investments such as non-traded real estate investment trusts, fixed and variable annuities, and insurance products. The firm operates over 500 offices in all 50 states, focusing on building long-term relationships with its advisor base while leveraging technology-enabled platforms to deliver scalable services. Binah Capital Group also maintains an investment banking division and wholesale distribution capabilities, positioning itself as a key consolidator in the independent wealth management industry.

CEO Mr. Craig Michael Gould · 150 employees · United States · https://www.binahcap.com