BILLBILLTechnology · Software - Application

BILL Stock Forecast: Bill Holdings, Inc. Price Predictions for 2026-2027

Last close, 3 Aug 2026
$47
+4.63% on the day

The 22 Wall Street analysts covering Bill Holdings, Inc. hold a median 12-month price target of $55 — +16.5% from the last close. Ticker Nerd's systematic factor model, run across ~4,600 US stocks, ranks it 66 of 100 as at 1 Aug 2026 — in the upper half.

Market cap
$4.5B
Ticker Nerd rank
66 / 100
Median analyst target
$55
Analysts covering
22
Total return, dividends reinvested
1W
+5.2%
1M
+16.7%
YTD
−13.4%
1Y
+13.2%
From 52W high
−16.1%
From 52W low
+47.7%
$32
$56
52-week range, adjusted closes · the dot is the last close
Ticker Nerd rank

BILL stock analysis: one number for the whole business

Consensus tells you what everyone already believes. The model scores Bill Holdings, Inc. on its factor families — the same systematic rank behind the Ticker Nerd portfolio.

Where the model ranks itAs at 1 Aug 2026
66 / 100

Percentile across ~4,600 US stocks on Ticker Nerd’s systematic factor model. Higher is better. How the model is built and tested

Revisions
93
Value
85
Issuance
70
Accruals
65
Volatility
49
Momentum
40
Quality
36
Growth
32
Size
25

Revisions (93): Analysts have, on balance, been raising their forecasts.

Growth (32): Sales and profits are flat, shrinking, or growing more slowly than they were.

Size (25): Larger than most of the companies we track — more scrutinised, less often mispriced.

The rank is the raw material. Whether the rules would actually own Bill Holdings, Inc. — and when they’d sell — is the membership.

Wall Street

BILL stock forecast 2026-2027: analyst price targets & predictions

The bullish and bearish analyst opinions on BILL, reported as data — targets and ratings, the market's view beside the model's.

Share price and the analyst range, 12 monthsAdjusted close, US dollars
$30$40$50$60$70$80Oct 25Jan 26Apr 26Jul 26BILLHigh $77Median $55Low $42

Price targets and ratings are third-party analyst estimates, reported here as data. They are not Ticker Nerd forecasts, and they are frequently wrong.

What Wall Street says22 analysts
14 Buy8 Hold0 Sell
Low $42Median $55High $77

The green dot is the last close — the median target sits +16.5% from it.

Recent analyst actionsNewest first
DateFirmActionRatingTarget
24 July 2026Truist SecuritiesMaintainsHold$38$44
22 June 2026TD CowenInitiatesBuy
22 June 2026TD CowenInitiatesBuy$43
10 June 2026Truist SecuritiesDowngradeHold
5 June 2026JP MorganMaintainsOverweight
19 May 2026Truist SecuritiesMaintainsBuy
12 May 2026Keefe, Bruyette & WoodsMaintainsMarket Perform
11 May 2026BairdMaintainsNeutral
11 May 2026Goldman SachsMaintainsBuy
5 May 2026OppenheimerMaintainsOutperform
30 Apr 2026Morgan StanleyMaintainsEqual-Weight
24 Apr 2026Truist SecuritiesMaintainsBuy
13 Apr 2026Goldman SachsMaintainsBuy
10 Feb 2026Canaccord GenuityMaintainsBuy
9 Feb 2026Goldman SachsMaintainsBuy
6 Feb 2026BTIGReiteratesBuy
6 Feb 2026Keefe, Bruyette & WoodsMaintainsMarket Perform
6 Feb 2026NeedhamReiteratesBuy
2 Feb 2026BTIGReiteratesBuy
22 Jan 2026CitigroupMaintainsBuy

Price targets and ratings are third-party analyst estimates, reported here as data. They are not Ticker Nerd forecasts, and they are frequently wrong.

Estimates

BILL analyst estimate revisions

Not the forecast itself — the direction analysts are revising it. Revision direction is one of the model's factor families.

Fundamentals

Bill Holdings, Inc. (BILL) financial data

A margin means little on its own. Each bar marks where the figure sits across the whole US universe we score.

Valuation
Trailing P/E
128.0×

Cheaper than 6% of US stocks

Price / sales
2.8×

Cheaper than 44% of US stocks

Price / book
1.2×

Cheaper than 67% of US stocks

EV / EBITDA
125.8×

Cheaper than 2% of US stocks

Growth & margins
Revenue growth (YoY)
13.5%

Higher than 62% of US stocks

Earnings growth (YoY)
13.5%

Higher than 54% of US stocks

Gross margin
81.6%

Higher than 92% of US stocks

Operating margin
1.1%

Higher than 50% of US stocks

Net margin
0.0%

Higher than 47% of US stocks

Returns & dividend
Return on equity
0.0%

Higher than 44% of US stocks

Return on assets
−0.3%

Higher than 42% of US stocks

Dividend yield

Bars mark the percentile across the ~4,600 US stocks Ticker Nerd covers, among those reporting the figure.

Peers

BILL vs competitors

The nearest names by industry and size, scored by the same model — like for like.

Its peer group, ranked by the same modelSoftware - Application
CompanyMarket capTKN rank
BILLBill Holdings, Inc.$4.5B
66
SRADSportradar Group AG$4.5B
49
LIFLife360, Inc.$4.4B
31
RNGRingCentral, Inc.$4.8B
100
DAVEDave, Inc.$4.8B
57
CVLTCommvault Systems, Inc.$4.9B
78
OCTVOctave Intelligence plc$4.9B
0
Market Radar

This page is one stock. Monday covers all of them.

Computed off the Friday close and sent before the US open.

Market Radar reports the week’s largest rank changes across roughly 4,600 US stocks, the factor behind each one, and where the market went. BILL appears on the weeks it earns a place.

Free, every Monday. Unsubscribe any time.

News

Latest BILL news & analysis

Intuit or BILL: Which Fintech Is Built for Future Growth?

Zacks Investment Research · 31 July 2026positive

A Zacks Investment Research article compares Intuit and BILL Holdings, noting that BILL's focused automation strategy and growing adoption among small and medium businesses position it favorably for long-term growth.

Why it matters — BILL watchers would care because the article highlights BILL's concentrated approach to automation and its traction with SMBs as key competitive advantages against a larger rival like Intuit.

5 Takeover Targets for the AI Revolution

InvestorPlace · 26 July 2026neutral

InvestorPlace published an article titled "5 Takeover Targets for the AI Revolution" by Tom Yeung, opening with the observation that getting acquired was the ultimate startup status symbol in the 2010s.

Why it matters — The article discusses potential AI-driven takeover targets, and BILL watchers would want to know if the company is identified among them or how industry consolidation trends could affect the company.

FAQ

Frequently asked questions about BILL stock

What is the BILL stock price forecast for 2026-2027?

The 22 Wall Street analysts covering Bill Holdings, Inc. have a median 12-month price target of $55, with estimates ranging from $42 to $77. These are third-party analyst estimates, not Ticker Nerd forecasts, and they are frequently wrong.

Is BILL stock a buy right now?

Of the 22 analysts covering Bill Holdings, Inc., 14 rate it a Buy, 8 a Hold and 0 a Sell. Ticker Nerd's systematic factor model ranks Bill Holdings, Inc. 66 out of 100 across roughly 4,600 US stocks as at 1 Aug 2026. None of this is personal advice — it does not consider your circumstances.

How does Ticker Nerd's model rank BILL?

As at 1 Aug 2026, Bill Holdings, Inc. ranks 66 out of 100 on Ticker Nerd's systematic factor model — a percentile across roughly 4,600 US stocks, built from its factor families. Its strongest factor family is Revisions (93 of 100).

Will BILL stock go up?

No one can know that. What the data says: the median 12-month target from 22 analysts implies +16.5% from the last close, and Ticker Nerd's factor model ranks Bill Holdings, Inc. 66 out of 100 as at 1 Aug 2026. Analyst targets are third-party estimates and frequently wrong; none of this is personal advice.

What is the BILL stock forecast for 2030?

No analyst covering Bill Holdings, Inc. publishes a 2030 price target — Wall Street targets run 12 to 18 months out. Sites quoting a 2030 price for BILL are extrapolating price history, which says nothing about the business. The furthest attributed numbers are the current analyst targets: $42 to $77 over the next 12 months.

How has BILL stock performed over the past year?

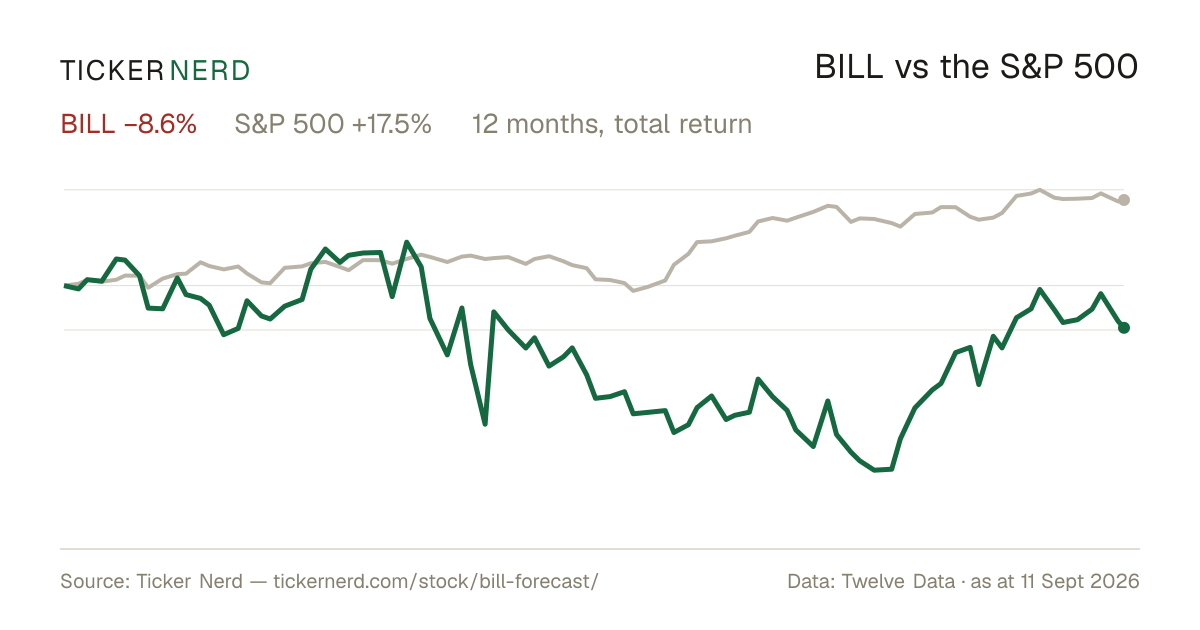
Bill Holdings, Inc. returned +13.2% over the 12 months to 3 Aug 2026, with dividends reinvested. Past performance does not indicate future returns.

What does Bill Holdings, Inc. do?

Bill Holdings Inc. is a technology company that provides cloud-based software for automating financial workflows for small and midsize businesses.

What is the latest news on BILL?

The most recent item we track (Zacks Investment Research, 31 July 2026): "Intuit or BILL: Which Fintech Is Built for Future Growth?". A Zacks Investment Research article compares Intuit and BILL Holdings, noting that BILL's focused automation strategy and growing adoption among small and medium businesses position it favorably for long-term growth.

Company

About Bill Holdings, Inc.

Bill Holdings Inc. is a technology company that provides cloud-based software for automating financial workflows for small and midsize businesses. Its platform focuses on streamlining accounts payable and accounts receivable, enabling users to generate and process invoices, manage approvals, and send and receive payments digitally. The software integrates with popular accounting systems, helping customers synchronize financial data and enhance cash flow visibility and control. Bill Holdings Inc. also offers spend and expense management tools that reduce reliance on manual processes and traditional expense reports, improving back-office efficiency. The company serves businesses directly as well as through partnerships with major financial institutions, accounting firms, and accounting software providers, embedding its solutions into broader financial ecosystems. Founded in 2006 and headquartered in San Jose, California, Bill Holdings Inc. plays a significant role in the digital transformation of financial operations for smaller enterprises seeking scalable, software-as-a-service solutions.

CEO Mr. Rene A. Lacerte · 2,364 employees · United States · https://www.bill.com