BTBDBTBDConsumer Cyclical · Restaurants

BTBD Stock Forecast: BT Brands, Inc. Price Predictions for 2026-2027

Last close, 3 Aug 2026
$1.18
−0.42% on the day

Ticker Nerd's systematic factor model, run across ~4,600 US stocks, ranks it 72 of 100 as at 1 Aug 2026 — in the upper half.

Market cap
$7.3M
Ticker Nerd rank
72 / 100
Median analyst target
Analysts covering
Total return, dividends reinvested
1W
+3.1%
1M
+8.8%
YTD
−15.5%
1Y
−28.4%
From 52W high
−61.2%
From 52W low
+13.0%
$1.04
$3.03
52-week range, adjusted closes · the dot is the last close
Ticker Nerd rank

BTBD stock analysis: one number for the whole business

Consensus tells you what everyone already believes. The model scores BT Brands, Inc. on its factor families — the same systematic rank behind the Ticker Nerd portfolio.

Where the model ranks itAs at 1 Aug 2026
72 / 100

Percentile across ~4,600 US stocks on Ticker Nerd’s systematic factor model. Higher is better. How the model is built and tested

Accruals
97
Size
94
Issuance
91
Growth
69
Value
50
Momentum
45
Volatility
41
Quality
34
Revisions
25

Accruals (97): Reported profit is backed by cash, and the company is not expanding recklessly.

Revisions (25): Analysts have, on balance, been cutting their forecasts.

The rank is the raw material. Whether the rules would actually own BT Brands, Inc. — and when they’d sell — is the membership.

Wall Street

BTBD stock forecast 2026-2027: analyst price targets & predictions

The bullish and bearish analyst opinions on BTBD, reported as data — targets and ratings, the market's view beside the model's.

Share price and the analyst range, 12 monthsAdjusted close, US dollars
$1.00$1.50$2.00$2.50$3.00Oct 25Jan 26Apr 26Jul 26BTBD

Price targets and ratings are third-party analyst estimates, reported here as data. They are not Ticker Nerd forecasts, and they are frequently wrong.

Price targets and ratings are third-party analyst estimates, reported here as data. They are not Ticker Nerd forecasts, and they are frequently wrong.

Estimates

BTBD analyst estimate revisions

Not the forecast itself — the direction analysts are revising it. Revision direction is one of the model's factor families.

Fundamentals

BT Brands, Inc. (BTBD) financial data

A margin means little on its own. Each bar marks where the figure sits across the whole US universe we score.

Valuation
Trailing P/E
−10.7×

Cheaper than 93% of US stocks

Price / sales
0.5×

Cheaper than 81% of US stocks

Price / book
1.2×

Cheaper than 65% of US stocks

EV / EBITDA
23.2×

Cheaper than 13% of US stocks

Growth & margins
Revenue growth (YoY)
−12.0%

Higher than 14% of US stocks

Earnings growth (YoY)
Gross margin
27.1%

Higher than 32% of US stocks

Operating margin
−8.2%

Higher than 27% of US stocks

Net margin
−8.5%

Higher than 21% of US stocks

Returns & dividend
Return on equity
−18.0%

Higher than 32% of US stocks

Return on assets
−2.0%

Higher than 37% of US stocks

Dividend yield

Bars mark the percentile across the ~4,600 US stocks Ticker Nerd covers, among those reporting the figure.

Peers

BTBD vs competitors

The nearest names by industry and size, scored by the same model — like for like.

Its peer group, ranked by the same modelRestaurants
CompanyMarket capTKN rank
BTBDBT Brands, Inc.$7.3M
72
CCHHCCH Holdings Ltd. (Malaysia)$6.1M
1
REBNReborn Coffee, Inc.$11.1M
9
CHSNChanson International Holding$4.0M
16
GTIMGood Times Restaurants, Inc.$14.6M
56
ARKRArk Restaurants Corp.$20.4M
41
RAVERave Restaurant Group, Inc.$44.8M
81
Market Radar

This page is one stock. Monday covers all of them.

Computed off the Friday close and sent before the US open.

Market Radar reports the week’s largest rank changes across roughly 4,600 US stocks, the factor behind each one, and where the market went. BTBD appears on the weeks it earns a place.

Free, every Monday. Unsubscribe any time.

FAQ

Frequently asked questions about BTBD stock

How does Ticker Nerd's model rank BTBD?

As at 1 Aug 2026, BT Brands, Inc. ranks 72 out of 100 on Ticker Nerd's systematic factor model — a percentile across roughly 4,600 US stocks, built from its factor families. Its strongest factor family is Accruals (97 of 100).

What is the BTBD stock forecast for 2030?

No analyst covering BT Brands, Inc. publishes a 2030 price target — Wall Street targets run 12 to 18 months out. Sites quoting a 2030 price for BTBD are extrapolating price history, which says nothing about the business.

How has BTBD stock performed over the past year?

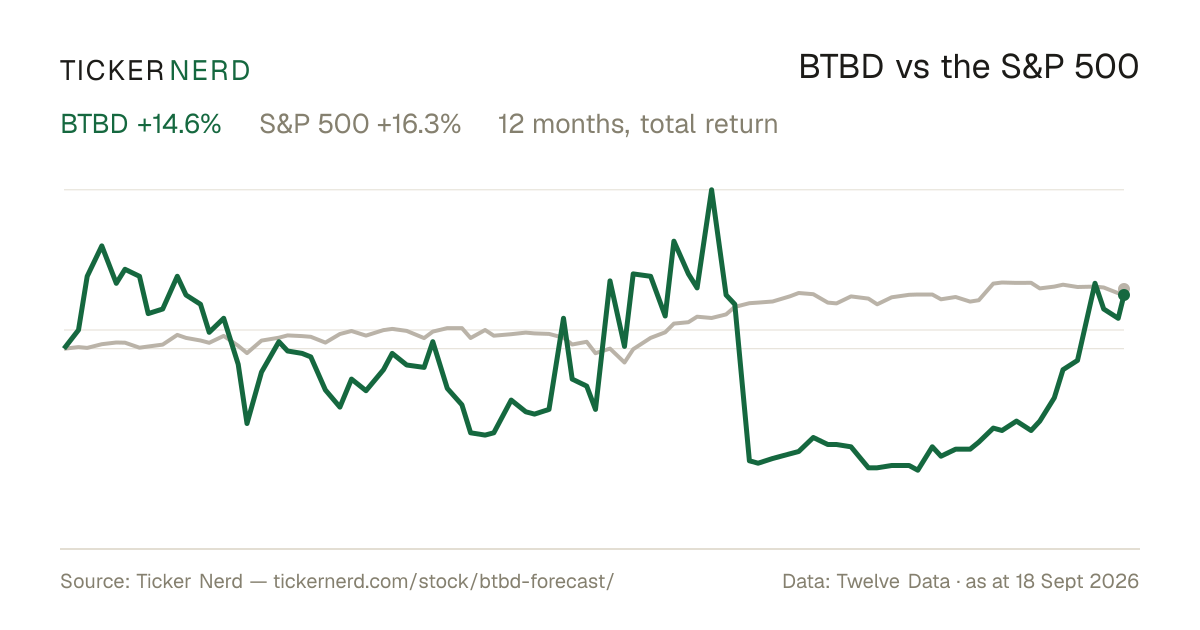
BT Brands, Inc. returned -28.4% over the 12 months to 3 Aug 2026, with dividends reinvested. Past performance does not indicate future returns.

What does BT Brands, Inc. do?

BT Brands Inc. owns and operates a portfolio of fast-food restaurants primarily in the north central region of the United States.

Company

About BT Brands, Inc.

BT Brands Inc. owns and operates a portfolio of fast-food restaurants primarily in the north central region of the United States. The company manages Burger Time drive-through locations in Minnesota, North Dakota, and South Dakota, offering burgers, chicken sandwiches, pulled pork sandwiches, chicken tenders, chicken chunks, sides, and soft drinks. It also operates a Dairy Queen franchise in Ham Lake, Minnesota, featuring burgers, chicken, sides, ice cream, desserts, and beverages. Additionally, BT Brands Inc. holds a significant ownership stake in Bagger Dave’s Burger Tavern, which provides burgers, pizzas, fries, beers, milkshakes, salads, and other menu items across locations in Michigan, Ohio, and Indiana. Founded in 1987 and headquartered in West Fargo, North Dakota, BT Brands Inc. focuses on delivering quick-service dining options to customers in these regional markets through its family of established restaurant brands.

CEO Mr. Gary W. Copperud · 28 employees · United States · https://itsburgertime.com