CCCCCCCCHealthcare · Biotechnology

CCCC Stock Forecast: C4 Therapeutics, Inc. Price Predictions for 2026-2027

Last close, 14 Aug 2026
$4.24
+3.92% on the day

The 7 Wall Street analysts covering C4 Therapeutics, Inc. hold a median 12-month price target of $11 — +159.4% from the last close. Ticker Nerd's systematic factor model, run across ~4,600 US stocks, ranks it 68 of 100 as at 15 Aug 2026 — in the upper half.

Market cap
$521.6M
Ticker Nerd rank
68 / 100
Median analyst target
$11
Analysts covering
7
Total return, dividends reinvested
1W
+13.7%
1M
+11.3%
YTD
+122.0%
1Y
+80.4%
From 52W high
−9.2%
From 52W low
+148.0%
$1.71
$4.67
52-week range, adjusted closes · the dot is the last close
Ticker Nerd rank

CCCC stock analysis: one number for the whole business

Consensus tells you what everyone already believes. The model scores C4 Therapeutics, Inc. on its factor families — the same systematic rank behind the Ticker Nerd portfolio.

Where the model ranks itAs at 15 Aug 2026
68 / 100

Percentile across ~4,600 US stocks on Ticker Nerd’s systematic factor model. Higher is better. How the model is built and tested

Growth
89
Revisions
83
Momentum
74
Size
53
Quality
48
Accruals
45
Issuance
45
Value
42
Volatility
13

Growth (89): Sales and profits are climbing, and climbing faster than before.

Volatility (13): The share price moves around a lot.

Built and run by Aslam Ghouse, an ex-Goldman Sachs quant trader with fourteen years in markets.

Wall Street

CCCC stock forecast 2026-2027: analyst price targets & predictions

The bullish and bearish analyst opinions on CCCC, reported as data — targets and ratings, the market's view beside the model's.

Share price and the analyst range, 12 monthsAdjusted close, US dollars
$0.00$5.00$10.00$15.00$20.00$25.00$30.00$35.00Oct 25Jan 26Apr 26Jul 26CCCCHigh $30Median $11Low $7

Price targets and ratings are third-party analyst estimates, reported here as data. They are not Ticker Nerd forecasts, and they are frequently wrong.

What Wall Street says7 analysts
7 Buy0 Hold0 Sell
Low $7Median $11High $30

The green dot is the last close — the median target sits +159.4% from it.

Recent analyst actionsNewest first
DateFirmActionRatingTarget
1 June 2026Evercore ISI GroupMaintainsOutperform$7.00$12
27 Feb 2026BarclaysMaintainsOverweight
23 Feb 2026Brookline CapitalMaintainsBuy
17 Dec 2025BarclaysMaintainsOverweight
2 Dec 2025TD CowenInitiatesBuy
23 Sept 2025BarclaysMaintainsOverweight
23 Sept 2025Wells FargoMaintainsOverweight
22 Sept 2025Stephens & Co.ReiteratesOverweight
17 Sept 2025BarclaysInitiatesOverweight
15 Sept 2025Stephens & Co.UpgradeOverweight
4 Sept 2025GuggenheimInitiatesBuy
19 Dec 2024Wells FargoUpgradeOverweight
18 Nov 2024Stephens & Co.InitiatesEqual-Weight
6 Aug 2024BMO CapitalReiteratesOutperform
9 May 2024StifelMaintainsBuy
9 May 2024Wells FargoMaintainsEqual-Weight
26 Feb 2024Morgan StanleyMaintainsEqual-Weight
23 Feb 2024StifelReiteratesBuy
29 Jan 2024JP MorganUpgradeNeutral
13 Dec 2023StifelUpgradeBuy

Price targets and ratings are third-party analyst estimates, reported here as data. They are not Ticker Nerd forecasts, and they are frequently wrong.

Market Radar

This page is one stock. Monday covers all of them.

Computed off the Friday close and sent before the US open.

Market Radar reports the week’s largest rank changes across roughly 4,600 US stocks, the factor behind each one, and where the market went. CCCC appears on the weeks it earns a place.

Free, every Monday. Unsubscribe any time.

Estimates

CCCC analyst estimate revisions

Not the forecast itself — the direction analysts are revising it. Revision direction is one of the model's factor families.

Which way the estimates are movingNext fiscal year
Analysts raising
3
Analysts cutting
0
Fundamentals

C4 Therapeutics, Inc. (CCCC) financial data

A margin means little on its own. Each bar marks where the figure sits across the whole US universe we score.

Valuation
Trailing P/E
−3.3×

Cheaper than 87% of US stocks

Price / sales
14.9×

Cheaper than 11% of US stocks

Price / book
2.1×

Cheaper than 45% of US stocks

EV / EBITDA
−3.1×

Cheaper than 75% of US stocks

Growth & margins
Revenue growth (YoY)
2.8%

Higher than 34% of US stocks

Earnings growth (YoY)
−15.0%

Higher than 22% of US stocks

Gross margin
Operating margin
−397.9%

Higher than 8% of US stocks

Net margin
−289.4%

Higher than 1% of US stocks

Returns & dividend
Return on equity
−48.1%

Higher than 22% of US stocks

Return on assets
−19.3%

Higher than 20% of US stocks

Dividend yield

Bars mark the percentile across the ~4,600 US stocks Ticker Nerd covers, among those reporting the figure.

Peers

CCCC vs competitors

The nearest names by industry and size, scored by the same model — like for like.

Its peer group, ranked by the same modelBiotechnology
CompanyMarket capTKN rank
CCCCC4 Therapeutics, Inc.$521.6M
68
PRLDPrelude Therapeutics, Inc.$524.7M
96
EVMNEvommune, Inc.$527.7M
10
OVIDOvid Therapeutics, Inc.$528.2M
67
ZURAZura Bio Ltd.$528.5M
32
MPLTMapLight Therapeutics, Inc.$512.8M
7
RLMDRelmada Therapeutics, Inc.$503.5M
69

Look up any of the roughly 4,600 stocks we score.

The rank is the raw material. Whether the rules would actually own C4 Therapeutics, Inc. — and when they’d sell — is the membership. See the Ticker Nerd 20 →

News

Latest CCCC news & analysis

C4 Therapeutics, Inc. (CCCC) Reports Q2 Loss, Tops Revenue Estimates

Zacks Investment Research · 11 Aug 2026positive

C4 Therapeutics reported a Q2 loss of $0.18 per share, narrower than the Zacks Consensus Estimate of a $0.23 loss and an improvement from the $0.37 loss reported in the same quarter last year. Revenue exceeded analyst expectations.

Why it matters — The smaller-than-expected quarterly loss and revenue beat suggest the company's financial performance is improving relative to analyst projections.

FAQ

Frequently asked questions about CCCC stock

What is the CCCC stock price forecast for 2026-2027?

The 7 Wall Street analysts covering C4 Therapeutics, Inc. have a median 12-month price target of $11, with estimates ranging from $7 to $30. These are third-party analyst estimates, not Ticker Nerd forecasts, and they are frequently wrong.

Is CCCC stock a buy right now?

Of the 7 analysts covering C4 Therapeutics, Inc., 7 rate it a Buy, 0 a Hold and 0 a Sell. Ticker Nerd's systematic factor model ranks C4 Therapeutics, Inc. 68 out of 100 across roughly 4,600 US stocks as at 15 Aug 2026. None of this is personal advice — it does not consider your circumstances.

How does Ticker Nerd's model rank CCCC?

As at 15 Aug 2026, C4 Therapeutics, Inc. ranks 68 out of 100 on Ticker Nerd's systematic factor model — a percentile across roughly 4,600 US stocks, built from its factor families. Its strongest factor family is Growth (89 of 100).

Will CCCC stock go up?

No one can know that. What the data says: the median 12-month target from 7 analysts implies +159.4% from the last close, and Ticker Nerd's factor model ranks C4 Therapeutics, Inc. 68 out of 100 as at 15 Aug 2026. Analyst targets are third-party estimates and frequently wrong; none of this is personal advice.

What is the CCCC stock forecast for 2030?

No analyst covering C4 Therapeutics, Inc. publishes a 2030 price target — Wall Street targets run 12 to 18 months out. Sites quoting a 2030 price for CCCC are extrapolating price history, which says nothing about the business. The furthest attributed numbers are the current analyst targets: $7 to $30 over the next 12 months.

How has CCCC stock performed over the past year?

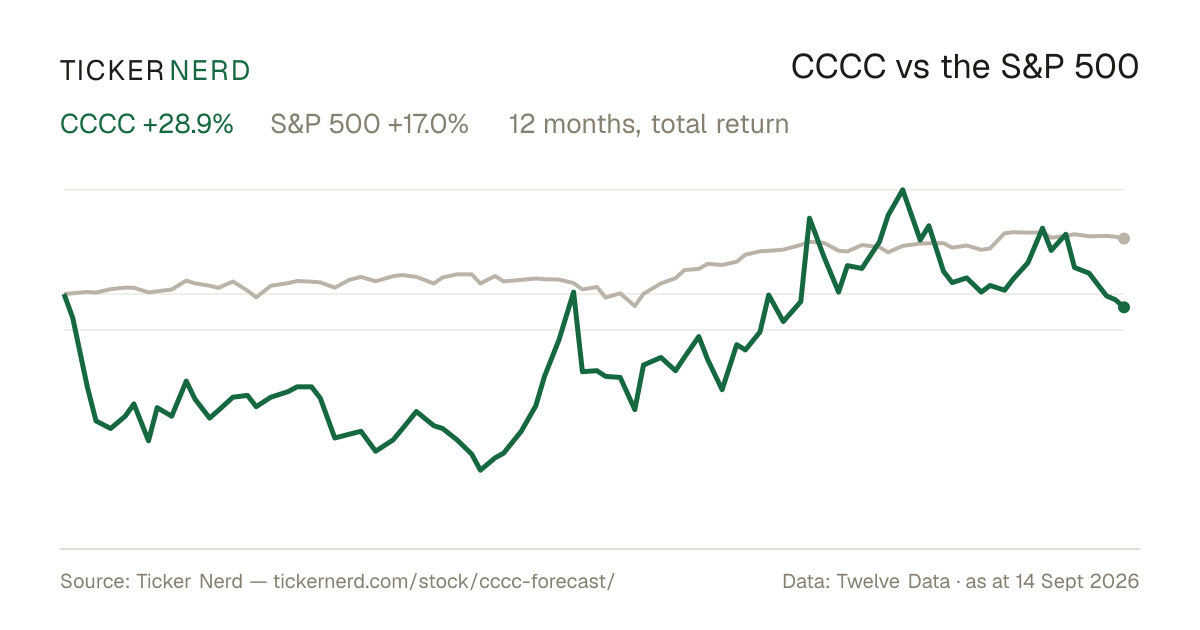
C4 Therapeutics, Inc. returned +80.4% over the 12 months to 14 Aug 2026, with dividends reinvested. Past performance does not indicate future returns.

What does C4 Therapeutics, Inc. do?

C4 Therapeutics Inc. is a clinical-stage biopharmaceutical company focused on developing novel therapeutic candidates that degrade disease-causing proteins through targeted protein degradation science.

What is the latest news on CCCC?

The most recent item we track (Zacks Investment Research, 11 Aug 2026): "C4 Therapeutics, Inc. (CCCC) Reports Q2 Loss, Tops Revenue Estimates". C4 Therapeutics reported a Q2 loss of $0.18 per share, narrower than the Zacks Consensus Estimate of a $0.23 loss and an improvement from the $0.37 loss reported in the same quarter last year. Revenue exceeded analyst expectations.

Company

About C4 Therapeutics, Inc.

C4 Therapeutics Inc. is a clinical-stage biopharmaceutical company focused on developing novel therapeutic candidates that degrade disease-causing proteins through targeted protein degradation science. Its lead product candidate, Cemsidomide, is an orally bioavailable MonoDAC degrader targeting IKZF1 and IKZF3 proteins, currently in Phase 1/2 clinical trials for multiple myeloma and non-Hodgkin lymphomas, including peripheral T-cell lymphoma and mantle cell lymphoma. The company is also advancing CFT1946, an orally bioavailable BiDAC degrader for BRAF V600 mutants in Phase 1/2 trials for melanoma, colorectal cancer, and other solid tumors, as well as CFT8919, a mutant-selective BiDAC degrader of epidermal growth factor receptor with L858R mutation for non-small cell lung cancer. C4 Therapeutics Inc. maintains strategic collaborations with partners such as Biogen, Roche, Merck KGaA, and others to expand its discovery and development efforts. Founded in 2015 and headquartered in Watertown, Massachusetts, it plays a key role in oncology by pioneering degraders that offer potentially improved efficacy and tolerability over traditional inhibitors.

CEO Mr. Andrew J. Hirsch M.B.A. · 104 employees · United States · https://www.c4therapeutics.com