CWKCWKReal Estate · Real Estate Services

CWK Stock Forecast: Cushman & Wakefield Ltd. Price Predictions for 2026-2027

Last close, 11 Sept 2026
$13
+1.74% on the day

The 12 Wall Street analysts covering Cushman & Wakefield Ltd. hold a median 12-month price target of $19 — +47.3% from the last close. Ticker Nerd's systematic factor model, run across ~4,600 US stocks, ranks it 58 of 100 as at 10 Sept 2026 — in the upper half.

Market cap
$3.0B
Ticker Nerd rank
58 / 100
Median analyst target
$19
Analysts covering
12
Revenue$2.8B+11.2% y/y
Operating income$134.2M
Net income$52.7M
Free cash flow$45.5M
Quarterly, 8 quarters to 30 June 2026 · latest quarter's figure shown
Total return, dividends reinvested
1W
−4.3%
1M
−6.2%
YTD
−20.3%
1Y
−22.2%
From 52W high
−25.0%
From 52W low
+9.3%
$12
$17
52-week range, adjusted closes · the dot is the last close
Ticker Nerd rank

CWK stock analysis: one number for the whole business

Consensus tells you what everyone already believes. The model scores Cushman & Wakefield Ltd. on its factor families — the same systematic rank behind the Ticker Nerd portfolio.

Where the model ranks itAs at 10 Sept 2026
58 / 100

Percentile across ~4,600 US stocks on Ticker Nerd’s systematic factor model. Higher is better. How the model is built and tested

Issuance
80
Quality
66
Revisions
62
Accruals
55
Value
55
Momentum
53
Growth
45
Volatility
35
Size
30

Issuance (80): The share count has been shrinking and the company is not leaning on new borrowing.

Volatility (35): The share price moves around a lot.

Size (30): Larger than most of the companies we track — more scrutinised, less often mispriced.

Built and run by Aslam Ghouse, an ex-Goldman Sachs quant trader with fourteen years in markets.

Wall Street

CWK stock forecast 2026-2027: analyst price targets & predictions

The bullish and bearish analyst opinions on CWK, reported as data — targets and ratings, the market's view beside the model's.

Share price and the analyst range, 12 monthsAdjusted close, US dollars
$12$14$16$18$20$22Oct 25Jan 26Apr 26Jul 26CWKHigh $21Median $19Low $15

Price targets and ratings are third-party analyst estimates, reported here as data. They are not Ticker Nerd forecasts, and they are frequently wrong.

Data provided by Twelve Data

What Wall Street says12 analysts
7 Buy5 Hold0 Sell
Low $15Median $19High $21

The green dot is the last close — the median target sits +47.3% from it.

Recent analyst actionsNewest first

Of the 20 most recent actions, 1 moved their price target up and 2 moved it down.

DateFirmActionRatingTarget
17 Aug 2026BarclaysMaintainsEqual-Weight$15$16
10 Aug 2026UBSMaintainsNeutral$17$15
13 Mar 2026BarclaysMaintainsEqual-Weight$19$15
13 Mar 2026BarclaysMaintainsEqual-Weight
2 Dec 2025BarclaysInitiatesEqual-Weight
21 Nov 2025CitigroupUpgradeBuy
12 Nov 2025CitigroupMaintainsNeutral
3 Nov 2025CitizensMaintainsMarket Outperform
10 Oct 2025UBSMaintainsNeutral
26 Aug 2025JP MorganMaintainsNeutral
13 Aug 2025Goldman SachsMaintainsBuy
8 Aug 2025Goldman SachsUpgradeBuy
6 Aug 2025JMP SecuritiesMaintainsMarket Outperform
21 July 2025JMP SecuritiesInitiatesMarket Outperform
2 July 2025UBSMaintainsNeutral
12 June 2025Morgan StanleyMaintainsOverweight
24 Apr 2025Morgan StanleyMaintainsOverweight
11 Apr 2025UBSMaintainsNeutral
10 Apr 2025JP MorganMaintainsNeutral
19 Mar 2025Goldman SachsMaintainsSell

Price targets and ratings are third-party analyst estimates, reported here as data. They are not Ticker Nerd forecasts, and they are frequently wrong.

Market Radar

This page is one stock. Monday covers all of them.

Computed off the Friday close and sent before the US open.

Market Radar reports the week’s largest rank changes across roughly 4,600 US stocks, the factor behind each one, and where the market went. CWK appears on the weeks it earns a place.

Free, every Monday. Unsubscribe any time.

Performance

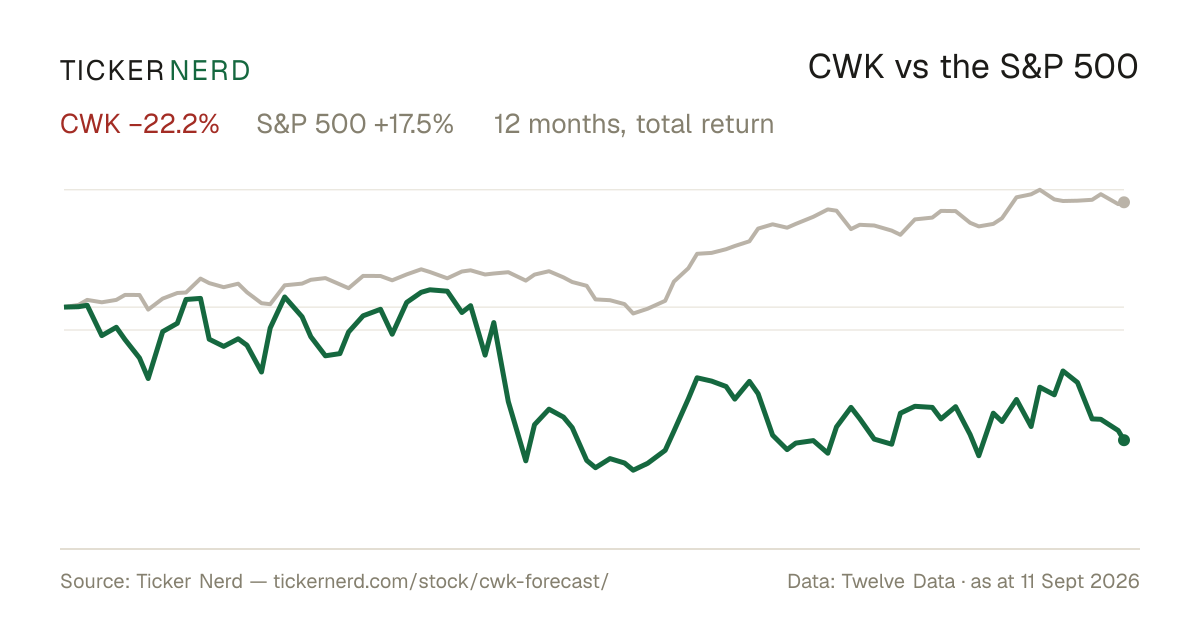
CWK vs the S&P 500

Both lines are total return — dividends reinvested — so the comparison is honest on both sides.

Over the twelve months to 11 Sept 2026, Cushman & Wakefield Ltd. returned −22.2% against +17.5% for the S&P 500, dividends included.

CWK vs S&P 500, last 12 monthsTotal return, rebased to 100
708090100110120Oct 25Jan 26Apr 26Jul 26CWKS&P 500

Download this chart as an image — free to reuse; link this page as the source.

Data provided by Twelve Data

Estimates

CWK analyst estimate revisions

Not the forecast itself — the direction analysts are revising it. Revision direction is one of the model's factor families.

Which way the estimates are movingNext fiscal year
EPS revision, 90 days
+1.2%
Analysts raising
6
Analysts cutting
2
Fundamentals

Cushman & Wakefield Ltd. (CWK) financial data

A margin means little on its own. Each bar marks where the figure sits across the whole US universe we score.

Valuation
Trailing P/E
43.7×

Cheaper than 17% of US stocks

Price / sales
0.3×

Cheaper than 90% of US stocks

Price / book
1.5×

Cheaper than 56% of US stocks

EV / EBITDA
9.7×

Cheaper than 39% of US stocks

Growth & margins
Revenue growth (YoY)
11.2%

Higher than 55% of US stocks

Earnings growth (YoY)
−8.0%

Higher than 28% of US stocks

Gross margin
18.5%

Higher than 19% of US stocks

Operating margin
4.9%

Higher than 55% of US stocks

Net margin
0.6%

Higher than 48% of US stocks

Returns & dividend
Return on equity
3.5%

Higher than 51% of US stocks

Return on assets
3.9%

Higher than 71% of US stocks

Dividend yield

Bars mark the percentile across the ~4,600 US stocks Ticker Nerd covers, among those reporting the figure.

Key statistics

Cushman & Wakefield Ltd. (CWK) statistics: revenue, profit & scale

The headline figures, each with its date. Every row carries its own link — cite it straight from here.

  • Cushman & Wakefield Ltd. has a market value of $3.0B and an enterprise value of $5.6B.

  • Revenue in the twelve months to 30 June 2026: $10.8B. The latest quarter grew 11.2% year on year.

  • Net income over the same four quarters: $69.1M, a 0.6% net margin.

  • Diluted earnings per share, trailing twelve months: $0.29.

  • Free cash flow in the twelve months to 30 June 2026: $249.1M.

  • Cushman & Wakefield Ltd. spent $23.9M on share buybacks in the twelve months to 30 June 2026.

  • Shares outstanding: 234.5M.

  • Trailing P/E: 43.7×; forward P/E: 7.4× — the forward figure prices analyst consensus estimates, not reported earnings.

  • Cushman & Wakefield Ltd. employs 53,000 people $204K of revenue per employee.

Statement figures: company filings via Twelve Data, four quarters to 30 June 2026 · market figures as at 10 Sept 2026

Data provided by Twelve Data

Peers

CWK vs competitors

The nearest names by industry and size, scored by the same model — like for like.

Its peer group, ranked by the same modelReal Estate Services
CompanyMarket capTKN rank
CWKCushman & Wakefield Ltd.$3.0B
58
IHSIHS Holding Ltd.$2.8B
79
OPENOpendoor Technologies, Inc.$2.7B
16
NMRKNewmark Group, Inc.$2.6B
90
MMIMarcus & Millichap, Inc.$1.2B
95
HBNBHotel101 Global Holdings Corp.$1.2B
10
COMPCompass, Inc. (New York)$7.8B
36

Look up any of the roughly 4,600 stocks we score.

The rank is the raw material. Whether the rules would actually own Cushman & Wakefield Ltd. — and when they’d sell — is the membership. See the Ticker Nerd 20 →

News

Latest CWK news & analysis

Cushman & Wakefield Releases 2026 Data Center Development Cost Guide, Citing 21% Rise in Per-MW Construction Costs

Business Wire · 3 Sept 2026neutral

Cushman & Wakefield published its 2026 Data Center Development Cost Guide, which covers U.S. and Canadian markets and reports that data center construction costs have risen an average of 21% per megawatt since the prior edition in Q4 2024. The guide offers an overview of development economics including land acquisition costs.

Why it matters — CWK watchers would care because the report highlights a key commercial real estate trend—rising data center development costs—that reflects activity in a significant growth sector for the firm.

Cushman & Wakefield: U.S. Life Sciences Market Moves Toward Rebalancing as Capital Returns and New Development Slows

Business Wire · 31 Aug 2026neutral

Cushman & Wakefield released its latest Life Sciences Update, reporting that the U.S. life sciences real estate sector is moving toward gradual rebalancing as development activity contracts, investment sales recover and funding conditions strengthen. While elevated vacancy and softer rents continue to weigh on near-term fundamentals, a reduced construction pipeline and improving demand indicators are positioning the market for healthier long-term growth.

Why it matters — This update offers CWK watchers insight into the trajectory of an important property sector the firm analyzes and advises on, signaling a shift from near-term softness toward more balanced market conditions.

Cushman & Wakefield Strengthens Capital Markets Platform with Addition of Loan Restructuring Expert Steve Klein

Business Wire · 24 Aug 2026positive

Cushman & Wakefield announced the addition of Steve Klein to its Equity, Debt & Structured Finance team as Managing Director and Loan Restructuring Practice Lead. Klein's hiring is part of an effort to strengthen the company's Capital Markets platform.

Why it matters — This move adds specialized loan restructuring expertise to Cushman & Wakefield's Capital Markets offering, potentially enhancing its platform across asset classes and capital structures.

Are Investors Undervaluing Cushman & Wakefield (CWK) Right Now?

Zacks Investment Research · 18 Aug 2026positive

Zacks Investment Research published an article asking whether investors are undervaluing Cushman & Wakefield (CWK), highlighting its Zacks Rank system that emphasizes earnings estimates and estimate revisions, while also considering value, growth, and momentum trends.

Why it matters — CWK watchers would care because the piece suggests the stock may be undervalued and draws attention to earnings-estimate trends that often inform investor sentiment.

Cushman & Wakefield to Lease 1.1 MSF Industrial Facility in Phoenix on behalf of GO Industrial

Business Wire · 18 Aug 2026positive

GO Industrial has broken ground on a 1,100,500-square-foot industrial building at 9797 W. Buckeye Road in Phoenix, with delivery scheduled for Q2 2027. Cushman & Wakefield will lease the facility on behalf of GO Industrial, representing the only million-square-foot opportunity currently available in the market.

Why it matters — This gives Cushman & Wakefield a significant leasing assignment on a rare large-scale industrial asset in the Phoenix market, expanding its brokerage activity in the region.

FAQ

Frequently asked questions about CWK stock

What is the CWK stock price forecast for 2026-2027?

The 12 Wall Street analysts covering Cushman & Wakefield Ltd. have a median 12-month price target of $19, with estimates ranging from $15 to $21. These are third-party analyst estimates, not Ticker Nerd forecasts, and they are frequently wrong.

Is CWK stock a buy right now?

Of the 12 analysts covering Cushman & Wakefield Ltd., 7 rate it a Buy, 5 a Hold and 0 a Sell. Ticker Nerd's systematic factor model ranks Cushman & Wakefield Ltd. 58 out of 100 across roughly 4,600 US stocks as at 10 Sept 2026. None of this is personal advice — it does not consider your circumstances.

How does Ticker Nerd's model rank CWK?

As at 10 Sept 2026, Cushman & Wakefield Ltd. ranks 58 out of 100 on Ticker Nerd's systematic factor model — a percentile across roughly 4,600 US stocks, built from its factor families. Its strongest factor family is Issuance (80 of 100).

Will CWK stock go up?

No one can know that. What the data says: the median 12-month target from 12 analysts implies +47.3% from the last close, and Ticker Nerd's factor model ranks Cushman & Wakefield Ltd. 58 out of 100 as at 10 Sept 2026. Analyst targets are third-party estimates and frequently wrong; none of this is personal advice.

What is the CWK stock forecast for 2030?

No analyst covering Cushman & Wakefield Ltd. publishes a 2030 price target — Wall Street targets run 12 to 18 months out. Sites quoting a 2030 price for CWK are extrapolating price history, which says nothing about the business. The furthest attributed numbers are the current analyst targets: $15 to $21 over the next 12 months.

How has CWK stock performed over the past year?

Cushman & Wakefield Ltd. returned -22.2% over the 12 months to 11 Sept 2026, with dividends reinvested. Past performance does not indicate future returns.

What does Cushman & Wakefield Ltd. do?

Cushman & Wakefield Ltd. is a global commercial real estate services company that supports property owners, occupiers, and investors across a wide range of market needs.

What is the latest news on CWK?

The most recent item we track (Business Wire, 3 Sept 2026): "Cushman & Wakefield Releases 2026 Data Center Development Cost Guide, Citing 21% Rise in Per-MW Construction Costs". Cushman & Wakefield published its 2026 Data Center Development Cost Guide, which covers U.S. and Canadian markets and reports that data center construction costs have risen an average of 21% per megawatt since the prior edition in Q4 2024. The guide offers an overview of development economics including land acquisition costs.

Company

About Cushman & Wakefield Ltd.

Cushman & Wakefield Ltd. is a global commercial real estate services company that supports property owners, occupiers, and investors across a wide range of market needs. The company provides services such as leasing, capital markets advisory, property management, facilities management, project and development services, tenant representation, valuation, and strategic consulting. Its platform serves office, industrial, retail, logistics, hospitality, healthcare, residential, and data center properties, helping clients manage assets, space requirements, and transactions across major regions worldwide. Cushman & Wakefield Ltd. plays an important role in connecting real estate decision-makers with integrated advisory and operational services in the commercial property market.

CEO Ms. Michelle Marie MacKay · 53,000 employees · United States · https://www.cushmanwakefield.com