DBIDBIConsumer Cyclical · Footwear & Accessories

DBI Stock Forecast: Designer Brands, Inc. Price Predictions for 2026-2027

Last close, 3 Aug 2026
$6.52
+7.95% on the day

The 2 Wall Street analysts covering Designer Brands, Inc. hold a median 12-month price target of $7.75 — +18.9% from the last close. Ticker Nerd's systematic factor model, run across ~4,600 US stocks, ranks it 93 of 100 as at 1 Aug 2026 — among the strongest tenth. Here, the model and the Street point the same way.

Market cap
$306.7M
Ticker Nerd rank
93 / 100
Median analyst target
$7.75
Analysts covering
2
Total return, dividends reinvested
1W
+11.3%
1M
+18.1%
YTD
−10.7%
1Y
+165.5%
From 52W high
−27.9%
From 52W low
+146.3%
$2.65
$9.04
52-week range, adjusted closes · the dot is the last close
Ticker Nerd rank

DBI stock analysis: one number for the whole business

Consensus tells you what everyone already believes. The model scores Designer Brands, Inc. on its factor families — the same systematic rank behind the Ticker Nerd portfolio.

Where the model ranks itAs at 1 Aug 2026
93 / 100

Percentile across ~4,600 US stocks on Ticker Nerd’s systematic factor model. Higher is better. How the model is built and tested

Issuance
93
Growth
88
Accruals
82
Momentum
76
Value
71
Size
61
Revisions
59
Quality
57
Volatility
11

Issuance (93): The share count has been shrinking and the company is not leaning on new borrowing.

Volatility (11): The share price moves around a lot.

The rank is the raw material. Whether the rules would actually own Designer Brands, Inc. — and when they’d sell — is the membership.

Wall Street

DBI stock forecast 2026-2027: analyst price targets & predictions

The bullish and bearish analyst opinions on DBI, reported as data — targets and ratings, the market's view beside the model's.

Share price and the analyst range, 12 monthsAdjusted close, US dollars
$2.00$4.00$6.00$8.00$10.00Oct 25Jan 26Apr 26Jul 26DBIHigh $8.00Median $7.75Low $7.50

Price targets and ratings are third-party analyst estimates, reported here as data. They are not Ticker Nerd forecasts, and they are frequently wrong.

What Wall Street says2 analysts
0 Buy2 Hold0 Sell
Low $7.50Median $7.75High $8.00

The green dot is the last close — the median target sits +18.9% from it.

Recent analyst actionsNewest first
DateFirmActionRatingTarget
10 June 2026Telsey Advisory GroupMaintainsMarket Perform$7.00$8.00
10 June 2026UBSMaintainsNeutral$8.00$7.50
1 June 2026UBSMaintainsNeutral
27 Mar 2026Telsey Advisory GroupMaintainsMarket Perform
26 Mar 2026Telsey Advisory GroupMaintainsMarket Perform
19 Mar 2026Telsey Advisory GroupMaintainsMarket Perform
11 Mar 2026UBSMaintainsNeutral
12 Feb 2026Telsey Advisory GroupMaintainsMarket Perform
8 Jan 2026UBSMaintainsNeutral
10 Dec 2025Telsey Advisory GroupMaintainsMarket Perform
10 Dec 2025UBSMaintainsNeutral
9 Dec 2025Telsey Advisory GroupMaintainsMarket Perform
3 Dec 2025Telsey Advisory GroupMaintainsMarket Perform
3 Dec 2025UBSMaintainsNeutral
10 Sept 2025Telsey Advisory GroupMaintainsMarket Perform
9 Sept 2025Telsey Advisory GroupMaintainsMarket Perform
4 Sept 2025UBSMaintainsNeutral
3 Sept 2025Telsey Advisory GroupMaintainsMarket Perform
11 June 2025Telsey Advisory GroupMaintainsMarket Perform
11 June 2025UBSMaintainsNeutral

Price targets and ratings are third-party analyst estimates, reported here as data. They are not Ticker Nerd forecasts, and they are frequently wrong.

Estimates

DBI analyst estimate revisions

Not the forecast itself — the direction analysts are revising it. Revision direction is one of the model's factor families.

Which way the estimates are movingNext fiscal year
EPS revision, 90 days
+3.7%
Analysts raising
2
Analysts cutting
0
Fundamentals

Designer Brands, Inc. (DBI) financial data

A margin means little on its own. Each bar marks where the figure sits across the whole US universe we score.

Valuation
Trailing P/E
27.5×

Cheaper than 30% of US stocks

Price / sales
0.1×

Cheaper than 96% of US stocks

Price / book
1.1×

Cheaper than 70% of US stocks

EV / EBITDA
11.2×

Cheaper than 34% of US stocks

Growth & margins
Revenue growth (YoY)
1.4%

Higher than 32% of US stocks

Earnings growth (YoY)
1.4%

Higher than 38% of US stocks

Gross margin
45.3%

Higher than 58% of US stocks

Operating margin
2.3%

Higher than 52% of US stocks

Net margin
0.4%

Higher than 47% of US stocks

Returns & dividend
Return on equity
5.6%

Higher than 54% of US stocks

Return on assets
2.3%

Higher than 61% of US stocks

Dividend yield
3.3%

Higher than 69% of US dividend payers

Bars mark the percentile across the ~4,600 US stocks Ticker Nerd covers, among those reporting the figure.

Peers

DBI vs competitors

The nearest names by industry and size, scored by the same model — like for like.

Its peer group, ranked by the same modelFootwear & Accessories
CompanyMarket capTKN rank
DBIDesigner Brands, Inc.$306.7M
93
FWDIForward Industries, Inc.$301.0M
19
FOSLFossil Group, Inc.$288.9M
59
RCKYRocky Brands, Inc.$366.0M
94
WEYSWeyco Group, Inc.$372.4M
77
VRAVera Bradley, Inc.$95.3M
81
WWWWolverine World Wide, Inc.$1.6B
79
Market Radar

This page is one stock. Monday covers all of them.

Computed off the Friday close and sent before the US open.

Market Radar reports the week’s largest rank changes across roughly 4,600 US stocks, the factor behind each one, and where the market went. DBI appears on the weeks it earns a place.

Free, every Monday. Unsubscribe any time.

News

Latest DBI news & analysis

AM Best Removes From Under Review With Positive Implications and Upgrades Credit Ratings of The Fortegra Group, Inc.'s Insurance Subsidiaries

Business Wire · 31 July 2026positive

AM Best removed the insurance subsidiaries of The Fortegra Group, Inc. — a wholly owned subsidiary of DBI — from under review with positive implications and upgraded their Financial Strength Rating to A (Excellent) from A- (Excellent) and their Long-Term Issuer Credit Ratings to "a" (Excellent) from "a-" (Excellent).

Why it matters — The upgrade signals improved creditworthiness for Fortegra, which is wholly owned by DBI, potentially reflecting positively on the parent company's overall financial standing.

FAQ

Frequently asked questions about DBI stock

What is the DBI stock price forecast for 2026-2027?

The 2 Wall Street analysts covering Designer Brands, Inc. have a median 12-month price target of $7.75, with estimates ranging from $7.5 to $8. These are third-party analyst estimates, not Ticker Nerd forecasts, and they are frequently wrong.

Is DBI stock a buy right now?

Of the 2 analysts covering Designer Brands, Inc., 0 rate it a Buy, 2 a Hold and 0 a Sell. Ticker Nerd's systematic factor model ranks Designer Brands, Inc. 93 out of 100 across roughly 4,600 US stocks as at 1 Aug 2026. None of this is personal advice — it does not consider your circumstances.

How does Ticker Nerd's model rank DBI?

As at 1 Aug 2026, Designer Brands, Inc. ranks 93 out of 100 on Ticker Nerd's systematic factor model — a percentile across roughly 4,600 US stocks, built from its factor families. Its strongest factor family is Issuance (93 of 100).

Will DBI stock go up?

No one can know that. What the data says: the median 12-month target from 2 analysts implies +18.9% from the last close, and Ticker Nerd's factor model ranks Designer Brands, Inc. 93 out of 100 as at 1 Aug 2026. Analyst targets are third-party estimates and frequently wrong; none of this is personal advice.

What is the DBI stock forecast for 2030?

No analyst covering Designer Brands, Inc. publishes a 2030 price target — Wall Street targets run 12 to 18 months out. Sites quoting a 2030 price for DBI are extrapolating price history, which says nothing about the business. The furthest attributed numbers are the current analyst targets: $7.5 to $8 over the next 12 months.

How has DBI stock performed over the past year?

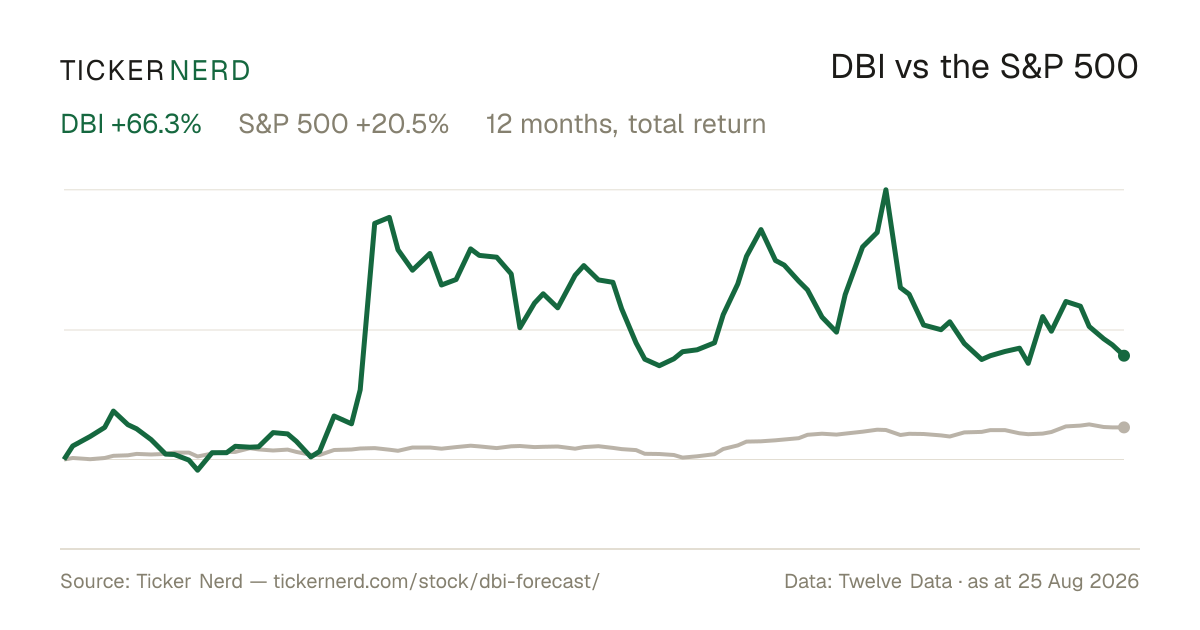
Designer Brands, Inc. returned +165.5% over the 12 months to 3 Aug 2026, with dividends reinvested. Past performance does not indicate future returns.

What does Designer Brands, Inc. do?

Designer Brands Inc. is a vertically integrated footwear and accessories retailer and wholesaler headquartered in Ohio, United States.

What is the latest news on DBI?

The most recent item we track (Business Wire, 31 July 2026): "AM Best Removes From Under Review With Positive Implications and Upgrades Credit Ratings of The Fortegra Group, Inc.'s Insurance Subsidiaries". AM Best removed the insurance subsidiaries of The Fortegra Group, Inc. — a wholly owned subsidiary of DBI — from under review with positive implications and upgraded their Financial Strength Rating to A (Excellent) from A- (Excellent) and their Long-Term Issuer Credit Ratings to "a" (Excellent) from "a-" (Excellent).

Company

About Designer Brands, Inc.

Designer Brands Inc. is a vertically integrated footwear and accessories retailer and wholesaler headquartered in Ohio, United States. The primary purpose of the company is to offer a vast selection of high-quality shoes at competitive prices across various branded and exclusive products. Designer Brands operates under several key segments including DSW (Designer Shoe Warehouse), a leading footwear retailer with a strong presence in North America, and Camuto Group, a significant design and sourcing company. These segments allow it to cater to a diverse customer base ranging from everyday consumers in need of casual and formal footwear to fashion-forward individuals seeking trendy styles. Designer Brands focuses on delivering value through a blend of physical retail locations and a robust digital platform, thereby enhancing customer experience and expanding market reach. In the broader financial market, the company plays a significant role due to its solid market position in the lifestyle and retail sectors, as well as its ability to adapt to changing consumer preferences and digital retail trends. This positions Designer Brands as a noteworthy entity in the retail apparel industry, reflecting its impact and relevance in the footwear market.

CEO Mr. Douglas M. Howe · 13,000 employees · United States · https://www.designerbrands.com