DDS Stock Forecast: Dillard's, Inc. Price Predictions for 2026-2027
The 3 Wall Street analysts covering Dillard's, Inc. hold a median 12-month price target of $496 — -19.1% from the last close. Ticker Nerd's systematic factor model, run across ~4,600 US stocks, ranks it 88 of 100 as at 1 Aug 2026 — inside the top quartile. The factors read stronger than the Street's target implies. That gap is the story on this page.
DDS stock analysis: one number for the whole business
Consensus tells you what everyone already believes. The model scores Dillard's, Inc. on its factor families — the same systematic rank behind the Ticker Nerd portfolio.
Percentile across ~4,600 US stocks on Ticker Nerd’s systematic factor model. Higher is better. How the model is built and tested
Value (91): The shares cost little relative to the profits and assets behind them — which can mean the market is too gloomy, or that the business really is in trouble.
Volatility (43): The share price moves around a lot.
Size (16): Larger than most of the companies we track — more scrutinised, less often mispriced.
The rank is the raw material. Whether the rules would actually own Dillard's, Inc. — and when they’d sell — is the membership.
DDS stock forecast 2026-2027: analyst price targets & predictions
The bullish and bearish analyst opinions on DDS, reported as data — targets and ratings, the market's view beside the model's.
Price targets and ratings are third-party analyst estimates, reported here as data. They are not Ticker Nerd forecasts, and they are frequently wrong.
The green dot is the last close — the median target sits −19.1% from it.
| Date | Firm | Action | Rating | Target |
|---|---|---|---|---|
| 6 May 2026 | UBS | Maintains | Sell | $460 → $465 |
| 25 Feb 2026 | JP Morgan | Maintains | Underweight | — |
| 25 Feb 2026 | Telsey Advisory Group | Maintains | Market Perform | — |
| 28 Nov 2025 | UBS | Maintains | Sell | — |
| 25 Nov 2025 | JP Morgan | Maintains | Underweight | — |
| 5 Nov 2025 | UBS | Maintains | Sell | — |
| 15 Aug 2025 | Telsey Advisory Group | Maintains | Market Perform | — |
| 15 Aug 2025 | UBS | Maintains | Sell | — |
| 28 July 2025 | JP Morgan | Maintains | Underweight | — |
| 16 May 2025 | Telsey Advisory Group | Maintains | Market Perform | — |
| 16 May 2025 | UBS | Maintains | Sell | — |
| 28 Feb 2025 | UBS | Maintains | Sell | — |
| 26 Feb 2025 | Telsey Advisory Group | Maintains | Market Perform | — |
| 19 Feb 2025 | UBS | Maintains | Sell | — |
| 15 Nov 2024 | Telsey Advisory Group | Maintains | Market Perform | — |
| 15 Nov 2024 | UBS | Maintains | Sell | — |
| 16 Aug 2024 | Telsey Advisory Group | Maintains | Market Perform | — |
| 16 Aug 2024 | UBS | Maintains | Sell | — |
| 17 May 2024 | Telsey Advisory Group | Maintains | Market Perform | — |
| 17 May 2024 | UBS | Maintains | Sell | — |
Price targets and ratings are third-party analyst estimates, reported here as data. They are not Ticker Nerd forecasts, and they are frequently wrong.
DDS analyst estimate revisions
Not the forecast itself — the direction analysts are revising it. Revision direction is one of the model's factor families.
Dillard's, Inc. (DDS) financial data
A margin means little on its own. Each bar marks where the figure sits across the whole US universe we score.
- Trailing P/E
- 14.0×
- Price / sales
- 1.4×
- Price / book
- 4.5×
- EV / EBITDA
- 9.7×
Cheaper than 49% of US stocks
Cheaper than 62% of US stocks
Cheaper than 23% of US stocks
Cheaper than 40% of US stocks
- Revenue growth (YoY)
- 2.7%
- Earnings growth (YoY)
- 52.9%
- Gross margin
- 45.2%
- Operating margin
- 14.0%
- Net margin
- 9.9%
Higher than 36% of US stocks
Higher than 78% of US stocks
Higher than 58% of US stocks
Higher than 72% of US stocks
Higher than 70% of US stocks
- Return on equity
- 33.8%
- Return on assets
- 10.5%
- Dividend yield
- 0.2%
Higher than 90% of US stocks
Higher than 93% of US stocks
Higher than 4% of US dividend payers
Bars mark the percentile across the ~4,600 US stocks Ticker Nerd covers, among those reporting the figure.
DDS vs competitors
The nearest names by industry and size, scored by the same model — like for like.
| Company | Market cap | TKN rank |
|---|---|---|
| DDSDillard's, Inc. | $9.2B | 88 |
| MMacy's, Inc. | $6.5B | 95 |
| KSSKohl's Corp. | $2.1B | 92 |
| PLBLPolibeli Group Ltd. | $2.0B | 3 |
| CHWYChewy, Inc.* | $9.2B | 58 |
| ALVAutoliv, Inc.* | $9.5B | 78 |
| EATBrinker International, Inc.* | $9.5B | 84 |
* Nearest Consumer Cyclical names by size — few department stores companies of this scale trade in the US universe.
This page is one stock. Monday covers all of them.
Computed off the Friday close and sent before the US open.
Market Radar reports the week’s largest rank changes across roughly 4,600 US stocks, the factor behind each one, and where the market went. DDS appears on the weeks it earns a place.
Frequently asked questions about DDS stock
What is the DDS stock price forecast for 2026-2027?
The 3 Wall Street analysts covering Dillard's, Inc. have a median 12-month price target of $496, with estimates ranging from $465 to $650. These are third-party analyst estimates, not Ticker Nerd forecasts, and they are frequently wrong.
Is DDS stock a buy right now?
Of the 3 analysts covering Dillard's, Inc., 0 rate it a Buy, 1 a Hold and 2 a Sell. Ticker Nerd's systematic factor model ranks Dillard's, Inc. 88 out of 100 across roughly 4,600 US stocks as at 1 Aug 2026. None of this is personal advice — it does not consider your circumstances.
How does Ticker Nerd's model rank DDS?
As at 1 Aug 2026, Dillard's, Inc. ranks 88 out of 100 on Ticker Nerd's systematic factor model — a percentile across roughly 4,600 US stocks, built from its factor families. Its strongest factor family is Value (91 of 100).
Will DDS stock go up?
No one can know that. What the data says: the median 12-month target from 3 analysts implies -19.1% from the last close, and Ticker Nerd's factor model ranks Dillard's, Inc. 88 out of 100 as at 1 Aug 2026. Analyst targets are third-party estimates and frequently wrong; none of this is personal advice.
What is the DDS stock forecast for 2030?
No analyst covering Dillard's, Inc. publishes a 2030 price target — Wall Street targets run 12 to 18 months out. Sites quoting a 2030 price for DDS are extrapolating price history, which says nothing about the business. The furthest attributed numbers are the current analyst targets: $465 to $650 over the next 12 months.
How has DDS stock performed over the past year?
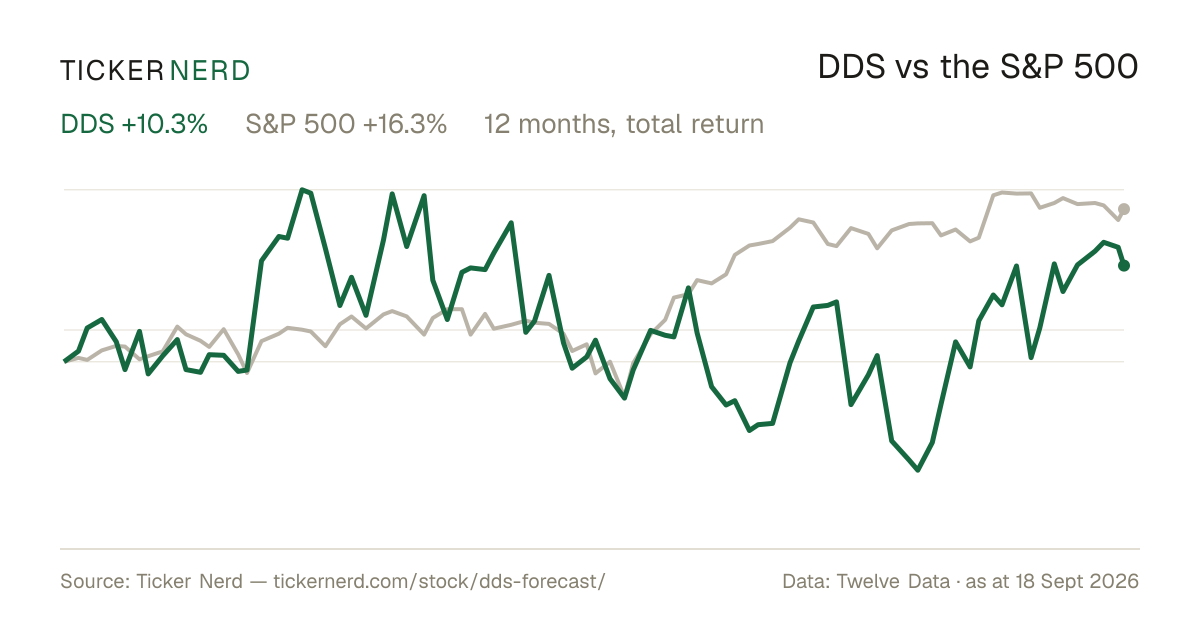
Dillard's, Inc. returned +36.5% over the 12 months to 3 Aug 2026, with dividends reinvested. Past performance does not indicate future returns.
What does Dillard's, Inc. do?
Dillard's Inc. is an American retail company that operates a chain of department stores concentrating largely on fashion retailing.
About Dillard's, Inc.
Dillard's Inc. is an American retail company that operates a chain of department stores concentrating largely on fashion retailing. Known for offering a variety of high-quality apparel, cosmetics, and home furnishings, Dillard’s caters to consumers seeking premium lifestyle products. Its primary function is to provide a diverse range of merchandise, positioning itself as a key player in the department store sector of the retail industry. Dillard's stores aim to deliver an upscale shopping experience with products sourced from both national and international brands, as well as its own exclusive labels. Founded in 1938 and headquartered in Little Rock, Arkansas, Dillard's serves numerous locations across the United States, primarily in the southern and western regions. It plays a significant role in the financial markets, not only as a retail operator but also as a publicly traded entity that influences consumer confidence and spending trends. Dillard's strategic focus on brand building, location expansion, and customer service excellence highlights its market significance in adapting to the evolving retail landscape.
CEO Mr. William T. Dillard II · United States · https://www.dillards.com