FIGFIGTechnology · Software - Application

FIG Stock Forecast: Figma, Inc. Price Predictions for 2026-2027

Last close, 14 Sept 2026
$24
+3.04% on the day

Ticker Nerd's systematic factor model, run across ~4,600 US stocks, ranks it 20 of 100 as at 14 Sept 2026 — in the weakest quartile.

Market cap
$11.4B
Ticker Nerd rank
20 / 100
Median analyst target
Analysts covering
Total return, dividends reinvested
1W
−0.9%
1M
−5.9%
YTD
−36.0%
1Y
−55.0%
From 52W high
−66.4%
From 52W low
+42.2%
$17
$71
52-week range, adjusted closes · the dot is the last close
Ticker Nerd rank

FIG stock analysis: one number for the whole business

Consensus tells you what everyone already believes. The model scores Figma, Inc. on its factor families — the same systematic rank behind the Ticker Nerd portfolio.

Where the model ranks itAs at 14 Sept 2026
20 / 100

Percentile across ~4,600 US stocks on Ticker Nerd’s systematic factor model. Higher is better. How the model is built and tested

Accruals
81
Revisions
76
Issuance
42
Quality
33
Value
25
Growth
21
Volatility
16
Size
13
Momentum
4

Accruals (81): Reported profit is backed by cash, and the company is not expanding recklessly.

Momentum (4): The shares have been drifting down relative to others.

Built and run by Aslam Ghouse, an ex-Goldman Sachs quant trader with fourteen years in markets.

Wall Street

FIG stock forecast 2026-2027: analyst price targets & predictions

The bullish and bearish analyst opinions on FIG, reported as data — targets and ratings, the market's view beside the model's.

Share price and the analyst range, 12 monthsAdjusted close, US dollars
$10$20$30$40$50$60$70Oct 25Jan 26Apr 26Jul 26FIG

Price targets and ratings are third-party analyst estimates, reported here as data. They are not Ticker Nerd forecasts, and they are frequently wrong.

Data provided by Twelve Data

Price targets and ratings are third-party analyst estimates, reported here as data. They are not Ticker Nerd forecasts, and they are frequently wrong.

Market Radar

This page is one stock. Monday covers all of them.

Computed off the Friday close and sent before the US open.

Market Radar reports the week’s largest rank changes across roughly 4,600 US stocks, the factor behind each one, and where the market went. FIG appears on the weeks it earns a place.

Free, every Monday. Unsubscribe any time.

Performance

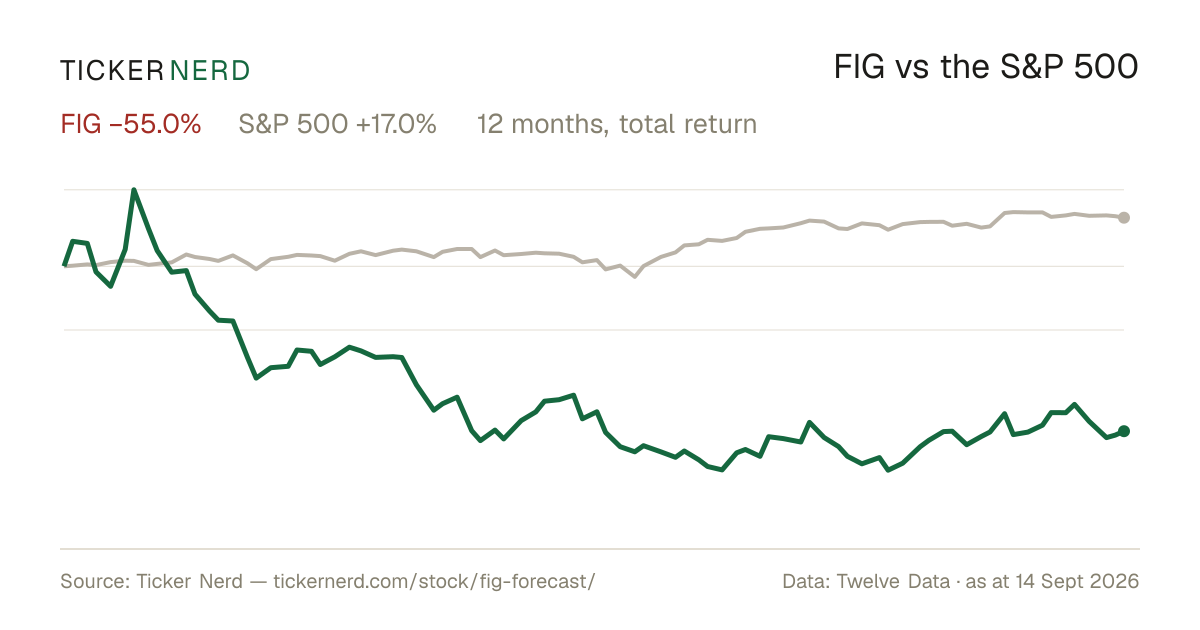
FIG vs the S&P 500

Both lines are total return — dividends reinvested — so the comparison is honest on both sides.

Over the twelve months to 14 Sept 2026, Figma, Inc. returned −55.0% against +17.0% for the S&P 500, dividends included.

FIG vs S&P 500, last 12 monthsTotal return, rebased to 100
20406080100120Oct 25Jan 26Apr 26Jul 26FIGS&P 500

Download this chart as an image — free to reuse; link this page as the source.

Data provided by Twelve Data

Estimates

FIG analyst estimate revisions

Not the forecast itself — the direction analysts are revising it. Revision direction is one of the model's factor families.

Fundamentals

Figma, Inc. (FIG) financial data

A margin means little on its own. Each bar marks where the figure sits across the whole US universe we score.

Valuation
Trailing P/E
−7.8×

Cheaper than 92% of US stocks

Price / sales
46.4×

Cheaper than 6% of US stocks

Price / book
16.1×

Cheaper than 6% of US stocks

EV / EBITDA
−18.6×

Cheaper than 89% of US stocks

Growth & margins
Revenue growth (YoY)
46.1%

Higher than 85% of US stocks

Earnings growth (YoY)
231.8%

Higher than 91% of US stocks

Gross margin
91.5%

Higher than 97% of US stocks

Operating margin
17.4%

Higher than 76% of US stocks

Net margin
−85.4%

Higher than 7% of US stocks

Returns & dividend
Return on equity
−105.4%

Higher than 13% of US stocks

Return on assets
−77.8%

Higher than 4% of US stocks

Dividend yield

Bars mark the percentile across the ~4,600 US stocks Ticker Nerd covers, among those reporting the figure.

Key statistics

Figma, Inc. (FIG) statistics: revenue, profit & scale

The headline figures, each with its date. Every row carries its own link — cite it straight from here.

  • Figma, Inc. has a market value of $11.4B and an enterprise value of $15.7B.

  • Shares outstanding: 487.5M.

  • Trailing P/E: −7.8×.

  • Figma, Inc. employs 1,886 people.

market figures as at 20 July 2026

Data provided by Twelve Data

Peers

FIG vs competitors

The nearest names by industry and size, scored by the same model — like for like.

Its peer group, ranked by the same modelSoftware - Application
CompanyMarket capTKN rank
FIGFigma, Inc.$11.4B
20
HUBSHubSpot, Inc.$12.5B
91
GRABGrab Holdings Ltd. (Singapore)$12.3B
39
MANHManhattan Associates, Inc.$12.7B
84
QNTQuantinuum, Inc.$12.7B
0
GWREGuidewire Software, Inc.$13.0B
69
DOCUDocuSign, Inc.$13.0B
93

Look up any of the roughly 4,600 stocks we score.

The rank is the raw material. Whether the rules would actually own Figma, Inc. — and when they’d sell — is the membership. See the Ticker Nerd 20 →

News

Latest FIG news & analysis

Figma General Counsel Sells 109,000 Shares for $2.8 Million

The Motley Fool · 9 Sept 2026neutral

Figma General Counsel Mulligan sold approximately 109,000 shares on September 3, 2026, for roughly $2.8 million. The transaction represented about 15% of the equity stake held before the filing.

Why it matters — Insider selling of this magnitude is worth monitoring for signals about management's view of the company's valuation.

Figma, Inc. (FIG) Presents at Goldman Sachs Communacopia + Technology Conference 2026 Transcript

Seeking Alpha · 8 Sept 2026neutral

Figma, Inc. presented at the Goldman Sachs Communacopia + Technology Conference 2026, with a transcript of the session published by Seeking Alpha. The presentation covered Figma's remarks at the conference.

Why it matters — The conference presentation offers FIG watchers insight into management's public commentary and positioning at a major technology investor event.

Figma Stock Slides as Hot Jobs Report Weighs on High-Multiple Software Stocks

Benzinga · 4 Sept 2026negative

Shares of Figma Inc. traded lower Friday afternoon, extending recent weakness as a hot jobs report weighed on high-multiple software stocks amid broader macro headwinds in the cloud software sector, despite the company's strong underlying fundamental momentum.

Why it matters — FIG watchers would care because the stock's decline reflects how broader macroeconomic pressures and elevated valuations are affecting the company's share price independently of its business fundamentals.

Figma, Inc. (FIG) Up 5.2% Since Last Earnings Report: Can It Continue?

Zacks Investment Research · 4 Sept 2026positive

Figma, Inc. reported earnings 30 days ago, and its stock has risen 5.2% since that report. The article considers what may come next for the stock following this gain.

Why it matters — A stock-price rise following its latest earnings report is notable for Figma watchers tracking the company's post-report performance and outlook.

Why Figma Stock Climbed 13% in August

The Motley Fool · 3 Sept 2026neutral

Figma's stock climbed 13% in August after the company beat analyst estimates on both revenue and earnings, though the result was reportedly not enough to fully please investors. Meanwhile, other software-sector earnings reports pointed to resilience despite concerns over AI disruption.

Why it matters — A FIG watcher would care because the August share-price gain, better-than-expected figures, and signs of software-sector resilience offer context on Figma's performance amid AI-driven market worries.

FAQ

Frequently asked questions about FIG stock

How does Ticker Nerd's model rank FIG?

As at 14 Sept 2026, Figma, Inc. ranks 20 out of 100 on Ticker Nerd's systematic factor model — a percentile across roughly 4,600 US stocks, built from its factor families. Its strongest factor family is Accruals (81 of 100).

What is the FIG stock forecast for 2030?

No analyst covering Figma, Inc. publishes a 2030 price target — Wall Street targets run 12 to 18 months out. Sites quoting a 2030 price for FIG are extrapolating price history, which says nothing about the business.

How has FIG stock performed over the past year?

Figma, Inc. returned -55.0% over the 12 months to 14 Sept 2026, with dividends reinvested. Past performance does not indicate future returns.

What does Figma, Inc. do?

Figma Inc. Class A Common Stock represents ownership in Figma Inc., a technology company that provides a cloud-based, AI-powered design and product development platform.

What is the latest news on FIG?

The most recent item we track (The Motley Fool, 9 Sept 2026): "Figma General Counsel Sells 109,000 Shares for $2.8 Million". Figma General Counsel Mulligan sold approximately 109,000 shares on September 3, 2026, for roughly $2.8 million. The transaction represented about 15% of the equity stake held before the filing.

Company

About Figma, Inc.

Figma Inc. Class A Common Stock represents ownership in Figma Inc., a technology company that provides a cloud-based, AI-powered design and product development platform. The company’s core offering enables teams to collaborate in real time on user interface and digital product design directly in the browser, supporting the full software creation lifecycle from ideation to developer handoff. Figma’s product suite includes Figma Design for interface creation, FigJam for whiteboarding and brainstorming, and complementary tools such as Figma Slides, Figma Draw, Dev Mode, Figma Sites, Figma Buzz, and Figma Make, which help streamline workflows across design, product, and engineering teams. The platform is used by organizations to create, refine, and ship digital products and experiences more efficiently, replacing fragmented design and collaboration tools with a centralized workspace. Figma Inc., founded in 2012 and headquartered in San Francisco, California, generates revenue primarily through subscription-based access to its platform, positioning it as a notable player in the software and digital design ecosystem.

CEO Mr. Dylan Field · 1,886 employees · United States · https://www.figma.com