FLGTFLGTHealthcare · Diagnostics & Research

FLGT Stock Forecast: Fulgent Genetics, Inc. Price Predictions for 2026-2027

Last close, 14 Aug 2026
$19
−0.48% on the day

The 1 Wall Street analysts covering Fulgent Genetics, Inc. hold a median 12-month price target of $19 — +2.4% from the last close. Ticker Nerd's systematic factor model, run across ~4,600 US stocks, ranks it 43 of 100 as at 13 Aug 2026 — in the lower half.

Market cap
$510.7M
Ticker Nerd rank
43 / 100
Median analyst target
$19
Analysts covering
1
Total return, dividends reinvested
1W
−3.0%
1M
−9.3%
YTD
−29.3%
1Y
−14.6%
From 52W high
−39.8%
From 52W low
+34.6%
$14
$31
52-week range, adjusted closes · the dot is the last close
Ticker Nerd rank

FLGT stock analysis: one number for the whole business

Consensus tells you what everyone already believes. The model scores Fulgent Genetics, Inc. on its factor families — the same systematic rank behind the Ticker Nerd portfolio.

Where the model ranks itAs at 13 Aug 2026
43 / 100

Percentile across ~4,600 US stocks on Ticker Nerd’s systematic factor model. Higher is better. How the model is built and tested

Issuance
81
Volatility
68
Accruals
63
Size
53
Momentum
52
Revisions
38
Quality
37
Value
35
Growth
35

Issuance (81): The share count has been shrinking and the company is not leaning on new borrowing.

Growth (35): Sales and profits are flat, shrinking, or growing more slowly than they were.

Built and run by Aslam Ghouse, an ex-Goldman Sachs quant trader with fourteen years in markets.

Wall Street

FLGT stock forecast 2026-2027: analyst price targets & predictions

The bullish and bearish analyst opinions on FLGT, reported as data — targets and ratings, the market's view beside the model's.

Share price and the analyst range, 12 monthsAdjusted close, US dollars
$15$20$25$30Oct 25Jan 26Apr 26Jul 26FLGTHigh $19Median $19Low $19

Price targets and ratings are third-party analyst estimates, reported here as data. They are not Ticker Nerd forecasts, and they are frequently wrong.

What Wall Street says1 analysts
0 Buy1 Hold0 Sell
Low $19Median $19High $19

The green dot is the last close — the median target sits +2.4% from it.

Recent analyst actionsNewest first
DateFirmActionRatingTarget
4 Aug 2026Piper SandlerMaintainsNeutral$15$19
5 May 2026Piper SandlerReiteratesNeutral$30$15
5 May 2026Piper SandlerReiteratesNeutral
11 Nov 2025Piper SandlerMaintainsNeutral
5 Aug 2025UBSUpgradeBuy
4 Aug 2025Piper SandlerMaintainsNeutral
6 May 2025Piper SandlerMaintainsNeutral
5 May 2025Raymond JamesReiteratesOutperform
4 Mar 2025Piper SandlerMaintainsNeutral
11 Nov 2024Piper SandlerMaintainsNeutral
6 Mar 2024Piper SandlerMaintainsNeutral
7 Dec 2023UBSInitiatesNeutral
16 Oct 2023Piper SandlerMaintainsNeutral
2 Mar 2023Credit SuisseMaintainsOutperform
8 Dec 2022Piper SandlerDowngradeNeutral
18 Nov 2022Raymond JamesInitiatesOutperform
14 Nov 2022Credit SuisseMaintainsOutperform
14 Nov 2022Piper SandlerMaintainsOverweight
25 Aug 2022Credit SuisseInitiatesOutperform
16 May 2022Piper SandlerMaintainsOverweight

Price targets and ratings are third-party analyst estimates, reported here as data. They are not Ticker Nerd forecasts, and they are frequently wrong.

Market Radar

This page is one stock. Monday covers all of them.

Computed off the Friday close and sent before the US open.

Market Radar reports the week’s largest rank changes across roughly 4,600 US stocks, the factor behind each one, and where the market went. FLGT appears on the weeks it earns a place.

Free, every Monday. Unsubscribe any time.

Estimates

FLGT analyst estimate revisions

Not the forecast itself — the direction analysts are revising it. Revision direction is one of the model's factor families.

Which way the estimates are movingNext fiscal year
Analysts raising
0
Analysts cutting
1
Fundamentals

Fulgent Genetics, Inc. (FLGT) financial data

A margin means little on its own. Each bar marks where the figure sits across the whole US universe we score.

Valuation
Trailing P/E
−9.4×

Cheaper than 92% of US stocks

Price / sales
1.6×

Cheaper than 59% of US stocks

Price / book
0.5×

Cheaper than 85% of US stocks

EV / EBITDA
−2.9×

Cheaper than 74% of US stocks

Growth & margins
Revenue growth (YoY)
4.4%

Higher than 37% of US stocks

Earnings growth (YoY)
4.4%

Higher than 41% of US stocks

Gross margin
30.1%

Higher than 35% of US stocks

Operating margin
−39.4%

Higher than 18% of US stocks

Net margin
−26.0%

Higher than 14% of US stocks

Returns & dividend
Return on equity
−8.1%

Higher than 37% of US stocks

Return on assets
−6.3%

Higher than 30% of US stocks

Dividend yield

Bars mark the percentile across the ~4,600 US stocks Ticker Nerd covers, among those reporting the figure.

Peers

FLGT vs competitors

The nearest names by industry and size, scored by the same model — like for like.

Its peer group, ranked by the same modelDiagnostics & Research
CompanyMarket capTKN rank
FLGTFulgent Genetics, Inc.$510.7M
43
CSTLCastle Biosciences, Inc.$891.7M
82
MYGNMyriad Genetics, Inc.$296.4M
55
OPKOPKO Health, Inc.$1.1B
75
BDSXBiodesix, Inc.$246.4M
87
FRNMFreenome, Inc.$1.3B
41
PSNLPersonalis, Inc.$1.5B
41

Look up any of the roughly 4,600 stocks we score.

The rank is the raw material. Whether the rules would actually own Fulgent Genetics, Inc. — and when they’d sell — is the membership. See the Ticker Nerd 20 →

News

Latest FLGT news & analysis

Fulgent Genetics, Inc. (FLGT) Q2 2026 Earnings Call Transcript

Seeking Alpha · 31 July 2026neutral

Fulgent Genetics, Inc. released the transcript of its Q2 2026 earnings call, detailing the company's financial performance and operational results for the quarter.

Why it matters — Earnings call transcripts provide investors and analysts with direct insight into management's commentary on financial results, business trends, and forward-looking outlook.

Fulgent Genetics Q2 Earnings Call Highlights

MarketBeat · 30 July 2026neutral

Fulgent Genetics reported second-quarter 2026 revenue of $85.4 million, up 20% sequentially and 4% year over year, helped by a full quarter from Bako Diagnostics and StrataDx. Management lowered its full-year revenue outlook due to lower collection rates during a transition to a new billing and revenue-cycle-management system.

Why it matters — Investors tracking FLGT would note the revenue growth from recent acquisitions as a positive, but the lowered full-year guidance signals near-term headwinds from the billing-system transition.

Fulgent Genetics, Inc. (FLGT) Reports Q2 Loss, Misses Revenue Estimates

Zacks Investment Research · 30 July 2026negative

Fulgent Genetics reported a quarterly loss of $0.58 per share, wider than the Zacks Consensus Estimate of a $0.46 loss, and a sharp decline from earnings of $0.07 per share a year ago.

Why it matters — The results fell short of analyst expectations and reversed a year-ago profit, signaling a potential deterioration in the company's near-term financial performance.

Fulgent Reports Second Quarter 2026 Financial Results

Business Wire · 30 July 2026negative

Fulgent Genetics reported its financial results for the second quarter of 2026, with revenue of $85.4 million and a GAAP net loss of $29.5 million, or $(1.05) per share.

Why it matters — The quarterly results reveal a significant net loss, which FLGT watchers would monitor as an indicator of the company's near-term financial performance and cash burn trajectory.

FAQ

Frequently asked questions about FLGT stock

What is the FLGT stock price forecast for 2026-2027?

The 1 Wall Street analysts covering Fulgent Genetics, Inc. have a median 12-month price target of $19, with estimates ranging from $19 to $19. These are third-party analyst estimates, not Ticker Nerd forecasts, and they are frequently wrong.

Is FLGT stock a buy right now?

Of the 1 analysts covering Fulgent Genetics, Inc., 0 rate it a Buy, 1 a Hold and 0 a Sell. Ticker Nerd's systematic factor model ranks Fulgent Genetics, Inc. 43 out of 100 across roughly 4,600 US stocks as at 13 Aug 2026. None of this is personal advice — it does not consider your circumstances.

How does Ticker Nerd's model rank FLGT?

As at 13 Aug 2026, Fulgent Genetics, Inc. ranks 43 out of 100 on Ticker Nerd's systematic factor model — a percentile across roughly 4,600 US stocks, built from its factor families. Its strongest factor family is Issuance (81 of 100).

Will FLGT stock go up?

No one can know that. What the data says: the median 12-month target from 1 analysts implies +2.4% from the last close, and Ticker Nerd's factor model ranks Fulgent Genetics, Inc. 43 out of 100 as at 13 Aug 2026. Analyst targets are third-party estimates and frequently wrong; none of this is personal advice.

What is the FLGT stock forecast for 2030?

No analyst covering Fulgent Genetics, Inc. publishes a 2030 price target — Wall Street targets run 12 to 18 months out. Sites quoting a 2030 price for FLGT are extrapolating price history, which says nothing about the business. The furthest attributed numbers are the current analyst targets: $19 to $19 over the next 12 months.

How has FLGT stock performed over the past year?

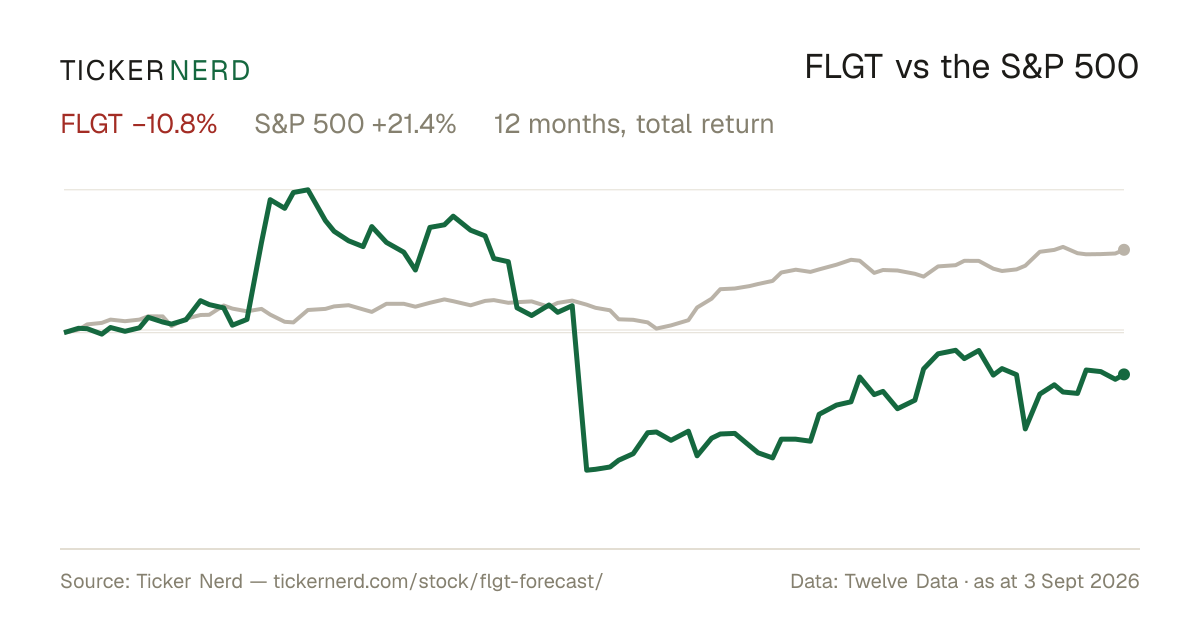
Fulgent Genetics, Inc. returned -14.6% over the 12 months to 14 Aug 2026, with dividends reinvested. Past performance does not indicate future returns.

What does Fulgent Genetics, Inc. do?

Fulgent Genetics Inc. is a technology-based company specializing in genetic testing and precision medicine services.

What is the latest news on FLGT?

The most recent item we track (Seeking Alpha, 31 July 2026): "Fulgent Genetics, Inc. (FLGT) Q2 2026 Earnings Call Transcript". Fulgent Genetics, Inc. released the transcript of its Q2 2026 earnings call, detailing the company's financial performance and operational results for the quarter.

Company

About Fulgent Genetics, Inc.

Fulgent Genetics Inc. is a technology-based company specializing in genetic testing and precision medicine services. It operates a laboratory services business that provides technical laboratory testing and professional interpretation of results by licensed physicians, delivering clinically actionable diagnostic information to healthcare providers. This segment focuses on genomic diagnostics, including advanced platforms like FulgentExome for patient-centric exome analysis and Fulgent Pipeline Manager for processing genetic sequencing data. Complementing this, Fulgent Genetics Inc. maintains a therapeutic development business centered on oncology, developing drug candidates for various cancers using a proprietary nanoencapsulation and targeted therapy platform to enhance drug delivery, solubility, and efficacy. The company applies technologies such as bioinformatics, AI-driven digital pathology like Eziopath, and workflow optimization across its operations. Primarily serving the United States market, it supports physicians in areas like pathology, PCR testing, and anatomic pathology through CLIA- and CAP-accredited labs. Founded in 1996 and headquartered in El Monte, California, Fulgent Genetics Inc. integrates diagnostics and therapeutics to advance precision medicine in healthcare.

CEO Mr. Ming Hsieh · 1,315 employees · United States · https://www.fulgentgenetics.com