FTREFTREHealthcare · Biotechnology

FTRE Stock Forecast: Fortrea Holdings, Inc. Price Predictions for 2026-2027

Last close, 11 Sept 2026
$17
+1.00% on the day

The 12 Wall Street analysts covering Fortrea Holdings, Inc. hold a median 12-month price target of $22 — +28.0% from the last close. Ticker Nerd's systematic factor model, run across ~4,600 US stocks, ranks it 97 of 100 as at 12 Sept 2026 — among the strongest tenth. Here, the model and the Street point the same way.

Market cap
$1.6B
Ticker Nerd rank
97 / 100
Median analyst target
$22
Analysts covering
12
Revenue$678.2M−4.5% y/y
Operating income$17.5M
Net income−$13.2M
Free cash flow$19.9M
Quarterly, 8 quarters to 30 June 2026 · latest quarter's figure shown
Total return, dividends reinvested
1W
−7.7%
1M
−11.9%
YTD
−0.3%
1Y
+68.0%
From 52W high
−17.0%
From 52W low
+104.6%
$8
$21
52-week range, adjusted closes · the dot is the last close
Ticker Nerd rank

FTRE stock analysis: one number for the whole business

Consensus tells you what everyone already believes. The model scores Fortrea Holdings, Inc. on its factor families — the same systematic rank behind the Ticker Nerd portfolio.

Where the model ranks itAs at 12 Sept 2026
97 / 100

Percentile across ~4,600 US stocks on Ticker Nerd’s systematic factor model. Higher is better. How the model is built and tested

Accruals
95
Growth
94
Momentum
89
Value
85
Issuance
77
Revisions
76
Quality
60
Size
39
Volatility
10

Accruals (95): Reported profit is backed by cash, and the company is not expanding recklessly.

Volatility (10): The share price moves around a lot.

Built and run by Aslam Ghouse, an ex-Goldman Sachs quant trader with fourteen years in markets.

Wall Street

FTRE stock forecast 2026-2027: analyst price targets & predictions

The bullish and bearish analyst opinions on FTRE, reported as data — targets and ratings, the market's view beside the model's.

Share price and the analyst range, 12 monthsAdjusted close, US dollars
$10$15$20$25Oct 25Jan 26Apr 26Jul 26FTREHigh $26Median $22Low $13

Price targets and ratings are third-party analyst estimates, reported here as data. They are not Ticker Nerd forecasts, and they are frequently wrong.

Data provided by Twelve Data

What Wall Street says12 analysts
5 Buy5 Hold2 Sell
Low $13Median $22High $26

The green dot is the last close — the median target sits +28.0% from it.

Recent analyst actionsNewest first

Of the 20 most recent actions, 6 moved their price target up and 0 moved it down.

DateFirmActionRatingTarget
4 Aug 2026TD CowenMaintainsBuy$19$23
31 July 2026CitigroupMaintainsBuy$20$22
30 July 2026BarclaysMaintainsEqual-Weight$18$22
30 July 2026Evercore ISI GroupMaintainsOutperform$20$25
30 July 2026Truist SecuritiesMaintainsBuy$19$26
13 July 2026MizuhoMaintainsNeutral$13$16
13 July 2026MizuhoMaintainsNeutral
24 June 2026BarclaysMaintainsEqual-Weight
12 May 2026MizuhoMaintainsNeutral
6 May 2026BarclaysMaintainsEqual-Weight
6 May 2026CitigroupMaintainsBuy
14 Apr 2026BarclaysMaintainsEqual-Weight
8 Apr 2026Evercore ISI GroupMaintainsOutperform
9 Mar 2026TD CowenUpgradeBuy
27 Feb 2026BairdMaintainsOutperform
27 Feb 2026BarclaysMaintainsEqual-Weight
22 Jan 2026TD CowenMaintainsHold
8 Jan 2026Truist SecuritiesUpgradeBuy
6 Jan 2026Evercore ISI GroupUpgradeOutperform
18 Dec 2025MizuhoMaintainsNeutral

Price targets and ratings are third-party analyst estimates, reported here as data. They are not Ticker Nerd forecasts, and they are frequently wrong.

Market Radar

This page is one stock. Monday covers all of them.

Computed off the Friday close and sent before the US open.

Market Radar reports the week’s largest rank changes across roughly 4,600 US stocks, the factor behind each one, and where the market went. FTRE appears on the weeks it earns a place.

Free, every Monday. Unsubscribe any time.

Performance

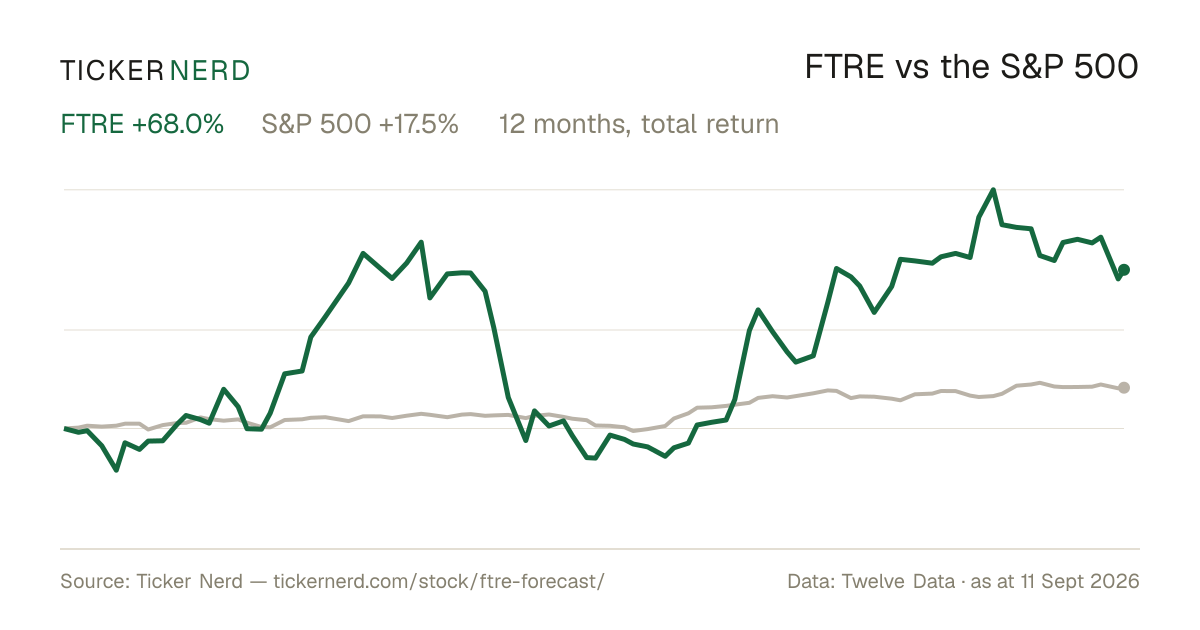
FTRE vs the S&P 500

Both lines are total return — dividends reinvested — so the comparison is honest on both sides.

Over the twelve months to 11 Sept 2026, Fortrea Holdings, Inc. returned +68.0% against +17.5% for the S&P 500, dividends included.

FTRE vs S&P 500, last 12 monthsTotal return, rebased to 100
80100120140160180200Oct 25Jan 26Apr 26Jul 26FTRES&P 500

Download this chart as an image — free to reuse; link this page as the source.

Data provided by Twelve Data

Estimates

FTRE analyst estimate revisions

Not the forecast itself — the direction analysts are revising it. Revision direction is one of the model's factor families.

Which way the estimates are movingNext fiscal year
EPS revision, 90 days
+4.2%
Analysts raising
7
Analysts cutting
4
Fundamentals

Fortrea Holdings, Inc. (FTRE) financial data

A margin means little on its own. Each bar marks where the figure sits across the whole US universe we score.

Valuation
Trailing P/E
522.3×

Cheaper than 1% of US stocks

Price / sales
0.6×

Cheaper than 79% of US stocks

Price / book
3.1×

Cheaper than 32% of US stocks

EV / EBITDA
26.3×

Cheaper than 10% of US stocks

Growth & margins
Revenue growth (YoY)
−4.5%

Higher than 20% of US stocks

Earnings growth (YoY)
Gross margin
20.5%

Higher than 22% of US stocks

Operating margin
2.6%

Higher than 50% of US stocks

Net margin
−3.2%

Higher than 26% of US stocks

Returns & dividend
Return on equity
−15.3%

Higher than 33% of US stocks

Return on assets
0.6%

Higher than 47% of US stocks

Dividend yield

Bars mark the percentile across the ~4,600 US stocks Ticker Nerd covers, among those reporting the figure.

Key statistics

Fortrea Holdings, Inc. (FTRE) statistics: revenue, profit & scale

The headline figures, each with its date. Every row carries its own link — cite it straight from here.

  • Fortrea Holdings, Inc. has a market value of $1.6B and an enterprise value of $2.6B.

  • Revenue in the twelve months to 30 June 2026: $2.7B. The latest quarter shrank 4.5% year on year.

  • Net income over the same four quarters: −$85.2M, a −3.2% net margin.

  • Diluted earnings per share, trailing twelve months: $−0.91.

  • Free cash flow in the twelve months to 30 June 2026: $196.0M, after $31.8M of capital spending.

  • Shares outstanding: 95.1M.

  • Trailing P/E: 522.3×; forward P/E: 15.1× — the forward figure prices analyst consensus estimates, not reported earnings.

  • Fortrea Holdings, Inc. employs 14,000 people $191K of revenue per employee.

Statement figures: company filings via Twelve Data, four quarters to 30 June 2026 · market figures as at 14 Sept 2026

Data provided by Twelve Data

Peers

FTRE vs competitors

The nearest names by industry and size, scored by the same model — like for like.

Its peer group, ranked by the same modelBiotechnology
CompanyMarket capTKN rank
FTREFortrea Holdings, Inc.$1.6B
97
FBRXForte Biosciences, Inc.$1.6B
NTLAIntellia Therapeutics, Inc.$1.6B
51
TSHATaysha Gene Therapies, Inc.$1.6B
42
INBXInhibrx Biosciences, Inc.$1.6B
27
ANABAnaptysBio, Inc.$1.6B
99
RXRXRecursion Pharmaceuticals, Inc.$1.7B
44

Look up any of the roughly 4,600 stocks we score.

The rank is the raw material. Whether the rules would actually own Fortrea Holdings, Inc. — and when they’d sell — is the membership. See the Ticker Nerd 20 →

News

Latest FTRE news & analysis

Fortrea Announces Grant of Inducement Awards Under Nasdaq Listing Rule 5635(c)(4)

GlobeNewsWire · 10 Sept 2026neutral

Fortrea announced on September 10, 2026, that it granted inducement awards of restricted stock units and performance share units to five newly hired employees. The awards were made under Nasdaq Listing Rule 5635(c)(4).

Why it matters — The grants indicate Fortrea is adding talent and using equity incentives to attract new hires.

Fortrea to Participate in September Investor Conferences

GlobeNewsWire · 10 Sept 2026neutral

Fortrea (Nasdaq: FTRE) announced that CEO Anshul Thakral, CFO Jason Knoblauch, and SVP of Investor Relations Tracy Krumme will participate in investor conferences in September, as announced on Sept. 10, 2026.

Why it matters — FTRE watchers tracking investor relations activity would note that the company's senior leadership is set to present at upcoming conferences.

Fortrea Leverages Early Phase Strengths to Accelerate Market Expansion

Benzinga · 2 Sept 2026positive

Fortrea has signed a definitive agreement to acquire the Early Phase Services division of Worldwide Clinical Trials in an all-cash transaction valued at approximately $45 million.

Why it matters — The acquisition leverages Fortrea's early phase strengths to accelerate its market expansion, which FTRE watchers would find relevant to the company's growth strategy.

Fortrea to Acquire Clinical Pharmacology Unit and Bioanalytical Laboratory Operations from Worldwide Clinical Trials

GlobeNewsWire · 2 Sept 2026positive

Fortrea announced it will acquire the clinical pharmacology unit and bioanalytical laboratory operations from Worldwide Clinical Trials. The acquisition adds dedicated bioanalytical capabilities and expanded capacity to Fortrea's early clinical development network.

Why it matters — The acquisition strengthens Fortrea's early clinical development offerings with new bioanalytical capabilities and added capacity, expanding its service network.

Fortrea Holdings: The Turnaround Is Showing Up In Earnings Before Revenue

Seeking Alpha · 30 Aug 2026positive

Fortrea Holdings is rated Buy, with an earnings turnaround driven by aggressive cost reductions rather than revenue growth. Adjusted EBITDA rose about 24% in H1 despite a roughly 3.4% revenue decline, while net new business awards increased about 19% year-over-year with a trailing-12-month book-to-bill ratio of 1.12x.

Why it matters — A Fortrea watcher would care because the company is showing improved profitability through cost cuts, but revenue conversion of new business remains uncertain, making earnings growth the key driver to monitor.

FAQ

Frequently asked questions about FTRE stock

What is the FTRE stock price forecast for 2026-2027?

The 12 Wall Street analysts covering Fortrea Holdings, Inc. have a median 12-month price target of $22, with estimates ranging from $13 to $26. These are third-party analyst estimates, not Ticker Nerd forecasts, and they are frequently wrong.

Is FTRE stock a buy right now?

Of the 12 analysts covering Fortrea Holdings, Inc., 5 rate it a Buy, 5 a Hold and 2 a Sell. Ticker Nerd's systematic factor model ranks Fortrea Holdings, Inc. 97 out of 100 across roughly 4,600 US stocks as at 12 Sept 2026. None of this is personal advice — it does not consider your circumstances.

How does Ticker Nerd's model rank FTRE?

As at 12 Sept 2026, Fortrea Holdings, Inc. ranks 97 out of 100 on Ticker Nerd's systematic factor model — a percentile across roughly 4,600 US stocks, built from its factor families. Its strongest factor family is Accruals (95 of 100).

Will FTRE stock go up?

No one can know that. What the data says: the median 12-month target from 12 analysts implies +28.0% from the last close, and Ticker Nerd's factor model ranks Fortrea Holdings, Inc. 97 out of 100 as at 12 Sept 2026. Analyst targets are third-party estimates and frequently wrong; none of this is personal advice.

What is the FTRE stock forecast for 2030?

No analyst covering Fortrea Holdings, Inc. publishes a 2030 price target — Wall Street targets run 12 to 18 months out. Sites quoting a 2030 price for FTRE are extrapolating price history, which says nothing about the business. The furthest attributed numbers are the current analyst targets: $13 to $26 over the next 12 months.

How has FTRE stock performed over the past year?

Fortrea Holdings, Inc. returned +68.0% over the 12 months to 11 Sept 2026, with dividends reinvested. Past performance does not indicate future returns.

What does Fortrea Holdings, Inc. do?

Fortrea Holdings Inc. is a global contract research organization that provides clinical development solutions to pharmaceutical, biotechnology, and medical device companies.

What is the latest news on FTRE?

The most recent item we track (GlobeNewsWire, 10 Sept 2026): "Fortrea Announces Grant of Inducement Awards Under Nasdaq Listing Rule 5635(c)(4)". Fortrea announced on September 10, 2026, that it granted inducement awards of restricted stock units and performance share units to five newly hired employees. The awards were made under Nasdaq Listing Rule 5635(c)(4).

Company

About Fortrea Holdings, Inc.

Fortrea Holdings Inc. is a global contract research organization that provides clinical development solutions to pharmaceutical, biotechnology, and medical device companies. Fortrea Holdings Inc. supports clients across the full clinical trial lifecycle, including Phase I through Phase IV studies, clinical pharmacology, data management, biostatistics, regulatory support, and post-approval evidence services. The company offers flexible delivery models such as full-service, functional service provider, and hybrid arrangements to fit different development needs. Its services are used by biopharma and medtech customers seeking to manage complex trials, improve operational efficiency, and generate the clinical evidence needed to advance products through development and approval. Fortrea Holdings Inc. is headquartered in Durham, North Carolina, and operates as a specialized services provider in the life sciences market.

CEO Mr. Anshul Thakral · 14,000 employees · United States · https://www.fortrea.com