GDGDIndustrials · Aerospace & Defense

GD Stock Forecast: General Dynamics Corp. Price Predictions for 2026-2027

Last close, 9 Sept 2026
$353
−1.10% on the day

The 24 Wall Street analysts covering General Dynamics Corp. hold a median 12-month price target of $430 — +21.9% from the last close. Ticker Nerd's systematic factor model, run across ~4,600 US stocks, ranks it 94 of 100 as at 8 Sept 2026 — among the strongest tenth. Here, the model and the Street point the same way.

Market cap
$95.4B
Ticker Nerd rank
94 / 100
Median analyst target
$430
Analysts covering
24
Revenue$14.1B+8.1% y/y
Operating income$1.5B
Net income$1.2B
Free cash flow$1.6B
Quarterly, 8 quarters to 30 June 2026 · latest quarter's figure shown
Total return, dividends reinvested
1W
−4.5%
1M
−10.0%
YTD
+6.1%
1Y
+11.7%
From 52W high
−10.9%
From 52W low
+13.3%
$311
$396
52-week range, adjusted closes · the dot is the last close
Ticker Nerd rank

GD stock analysis: one number for the whole business

Consensus tells you what everyone already believes. The model scores General Dynamics Corp. on its factor families — the same systematic rank behind the Ticker Nerd portfolio.

Where the model ranks itAs at 8 Sept 2026
94 / 100

Percentile across ~4,600 US stocks on Ticker Nerd’s systematic factor model. Higher is better. How the model is built and tested

Volatility
98
Value
94
Revisions
92
Issuance
85
Quality
80
Momentum
70
Accruals
68
Growth
48
Size
3

Volatility (98): The share price has been relatively steady.

Growth (48): Sales and profits are flat, shrinking, or growing more slowly than they were.

Size (3): Larger than most of the companies we track — more scrutinised, less often mispriced.

Built and run by Aslam Ghouse, an ex-Goldman Sachs quant trader with fourteen years in markets.

Wall Street

GD stock forecast 2026-2027: analyst price targets & predictions

The bullish and bearish analyst opinions on GD, reported as data — targets and ratings, the market's view beside the model's.

Share price and the analyst range, 12 monthsAdjusted close, US dollars
$300$350$400$450Oct 25Jan 26Apr 26Jul 26GDHigh $465Median $430Low $319

Price targets and ratings are third-party analyst estimates, reported here as data. They are not Ticker Nerd forecasts, and they are frequently wrong.

Data provided by Twelve Data

What Wall Street says24 analysts
13 Buy10 Hold1 Sell
Low $319Median $430High $465

The green dot is the last close — the median target sits +21.9% from it.

Recent analyst actionsNewest first

Of the 20 most recent actions, 10 moved their price target up and 0 moved it down.

DateFirmActionRatingTarget
4 Aug 2026Wells FargoMaintainsOverweight$400$440
3 Aug 2026UBSMaintainsNeutral$366$395
30 July 2026BNP ParibasMaintainsOutperform$390$430
30 July 2026CitigroupMaintainsNeutral$364$404
30 July 2026Morgan StanleyMaintainsOverweight$435$465
30 July 2026RBC CapitalMaintainsSector Perform$385$410
30 July 2026SusquehannaMaintainsPositive$420$455
30 July 2026TD CowenMaintainsBuy$390$420
9 July 2026JefferiesMaintainsBuy$400$440
9 July 2026JefferiesMaintainsBuy
6 July 2026B of A SecuritiesMaintainsBuy$400$415
6 July 2026B of A SecuritiesMaintainsBuy
11 June 2026JefferiesUpgradeBuy
18 May 2026CitigroupMaintainsNeutral
30 Apr 2026JP MorganMaintainsOverweight
30 Apr 2026RBC CapitalReiteratesSector Perform
30 Apr 2026UBSMaintainsNeutral
7 Apr 2026JefferiesMaintainsHold
2 Apr 2026CitigroupMaintainsNeutral
1 Apr 2026Wells FargoInitiatesOverweight

Price targets and ratings are third-party analyst estimates, reported here as data. They are not Ticker Nerd forecasts, and they are frequently wrong.

Market Radar

This page is one stock. Monday covers all of them.

Computed off the Friday close and sent before the US open.

Market Radar reports the week’s largest rank changes across roughly 4,600 US stocks, the factor behind each one, and where the market went. GD appears on the weeks it earns a place.

Free, every Monday. Unsubscribe any time.

Performance

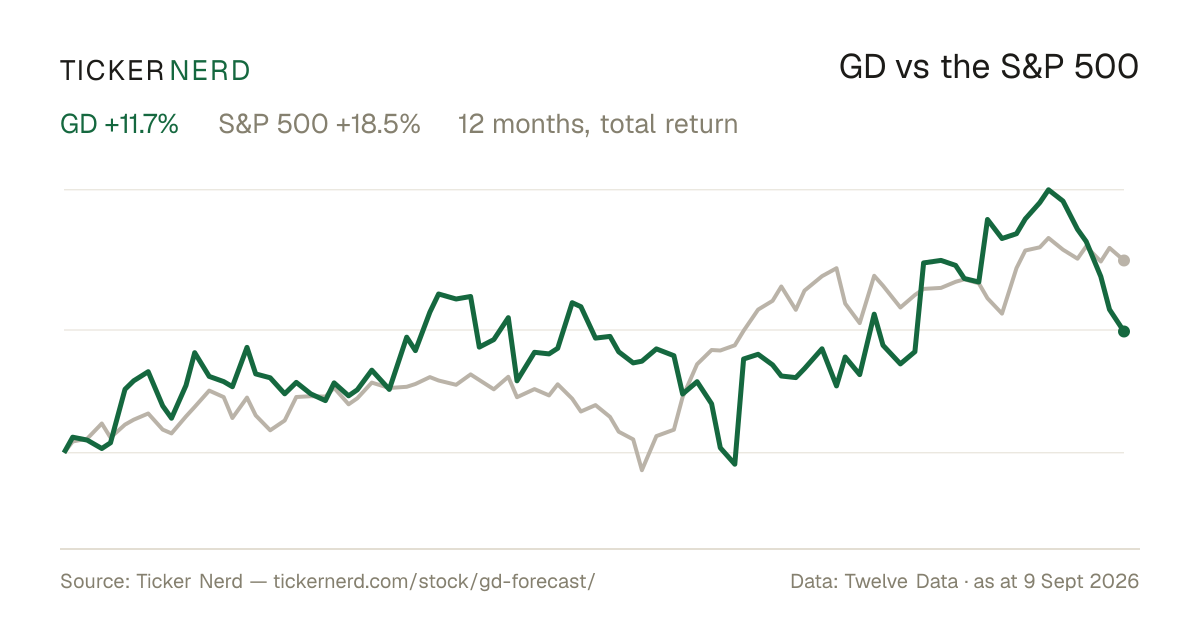
GD vs the S&P 500

Both lines are total return — dividends reinvested — so the comparison is honest on both sides.

Over the twelve months to 9 Sept 2026, General Dynamics Corp. returned +11.7% against +18.5% for the S&P 500, dividends included.

GD vs S&P 500, last 12 monthsTotal return, rebased to 100
100105110115120125Oct 25Jan 26Apr 26Jul 26GDS&P 500

Download this chart as an image — free to reuse; link this page as the source.

Data provided by Twelve Data

Estimates

GD analyst estimate revisions

Not the forecast itself — the direction analysts are revising it. Revision direction is one of the model's factor families.

Which way the estimates are movingNext fiscal year
EPS revision, 90 days
+2.1%
Analysts raising
17
Analysts cutting
0
Fundamentals

General Dynamics Corp. (GD) financial data

A margin means little on its own. Each bar marks where the figure sits across the whole US universe we score.

Valuation
Trailing P/E
21.5×

Cheaper than 35% of US stocks

Price / sales
1.7×

Cheaper than 56% of US stocks

Price / book
3.6×

Cheaper than 29% of US stocks

EV / EBITDA
15.1×

Cheaper than 22% of US stocks

Growth & margins
Revenue growth (YoY)
8.1%

Higher than 47% of US stocks

Earnings growth (YoY)
14.4%

Higher than 52% of US stocks

Gross margin
15.5%

Higher than 15% of US stocks

Operating margin
10.4%

Higher than 65% of US stocks

Net margin
8.2%

Higher than 66% of US stocks

Returns & dividend
Return on equity
17.8%

Higher than 79% of US stocks

Return on assets
6.1%

Higher than 81% of US stocks

Dividend yield
1.8%

Higher than 41% of US dividend payers

Bars mark the percentile across the ~4,600 US stocks Ticker Nerd covers, among those reporting the figure.

Key statistics

General Dynamics Corp. (GD) statistics: revenue, profit & scale

The headline figures, each with its date. Every row carries its own link — cite it straight from here.

  • General Dynamics Corp. has a market value of $95.4B and an enterprise value of $100.4B.

  • Revenue in the twelve months to 30 June 2026: $54.9B. The latest quarter grew 8.1% year on year.

  • Net income over the same four quarters: $4.5B, a 8.2% net margin.

  • Diluted earnings per share, trailing twelve months: $16.39.

  • Free cash flow in the twelve months to 30 June 2026: $6.4B, after $1.3B of capital spending.

  • General Dynamics Corp. spent $356.0M on share buybacks and $1.6B on dividends in the twelve months to 30 June 2026.

  • Shares outstanding: 270.4M.

  • Trailing P/E: 21.5×; forward P/E: 19.0× — the forward figure prices analyst consensus estimates, not reported earnings.

  • Forward dividend yield: 1.80%, paying out 38% of earnings.

  • General Dynamics Corp. employs 117,000 people $469K of revenue per employee.

Statement figures: company filings via Twelve Data, four quarters to 30 June 2026 · market figures as at 10 Sept 2026

Data provided by Twelve Data

Peers

GD vs competitors

The nearest names by industry and size, scored by the same model — like for like.

Its peer group, ranked by the same modelAerospace & Defense
CompanyMarket capTKN rank
GDGeneral Dynamics Corp.$95.4B
94
HWMHowmet Aerospace, Inc.$92.8B
75
LMTLockheed Martin Corp.$125.2B
96
NOCNorthrop Grumman Corp.$74.0B
85
TDGTransDigm Group, Inc.$64.5B
63
BAThe Boeing Co.$160.2B
46
HONAHoneywell Aerospace, Inc.$49.3B
0

Look up any of the roughly 4,600 stocks we score.

The rank is the raw material. Whether the rules would actually own General Dynamics Corp. — and when they’d sell — is the membership. See the Ticker Nerd 20 →

News

Latest GD news & analysis

General Dynamics (GD) Falls More Steeply Than Broader Market: What Investors Need to Know

Zacks Investment Research · 9 Sept 2026neutral

General Dynamics (GD) shares closed at $352.67 in the most recent trading day, down 1.1% from the prior session, a steeper decline than the broader market.

Why it matters — The move indicates GD underperformed the wider market on that trading day, which is relevant to investors tracking the stock's relative performance.

Here's Why General Dynamics (GD) is a Strong Growth Stock

Zacks Investment Research · 9 Sept 2026positive

Zacks Investment Research highlighted General Dynamics (GD) as a strong growth stock through its Zacks Style Scores feature, part of the Zacks Premium research service.

Why it matters — A positive assessment from a research service like Zacks could influence investor perception and interest in GD as a growth-oriented stock.

Can the Sea-Launched Cruise Missile Program Boost GD's Growth?

Zacks Investment Research · 4 Sept 2026positive

General Dynamics was awarded a $194.1 million Navy contract supporting sea-launched cruise missile programs, reinforcing its role in that area and providing added visibility into future strategic defense revenue.

Why it matters — The contract strengthens General Dynamics' position in naval missile support and offers watchers added line of sight into prospective strategic defense revenues.

GD or HWM: Which Is the Better Value Stock Right Now?

Zacks Investment Research · 2 Sept 2026neutral

Zacks Investment Research published a comparison article examining General Dynamics (GD) and Howmet (HWM) from the Aerospace-Defense sector, assessing which of the two stocks is more attractive to value investors. The piece invites investors to consider the relative value characteristics of both companies.

Why it matters — The comparison puts General Dynamics in the spotlight for value-oriented investors assessing its relative attractiveness against a peer in the aerospace-defense sector.

Jim Cramer Says This Tech Stock Is Up 40% For The Year: It Is A ‘Great' Company

Benzinga · 2 Sept 2026neutral

On CNBC's "Mad Money Lightning Round," Jim Cramer discussed KLA Corporation, calling it a "great" company that has gained 40% for the year, while noting its price-to-earnings multiple is still too high and it holds strong intellectual property.

Why it matters — A GD watcher would care because this news focuses on KLA Corporation rather than General Dynamics, offering no direct relevance to GD's business or outlook.

FAQ

Frequently asked questions about GD stock

What is the GD stock price forecast for 2026-2027?

The 24 Wall Street analysts covering General Dynamics Corp. have a median 12-month price target of $430, with estimates ranging from $319 to $465. These are third-party analyst estimates, not Ticker Nerd forecasts, and they are frequently wrong.

Is GD stock a buy right now?

Of the 24 analysts covering General Dynamics Corp., 13 rate it a Buy, 10 a Hold and 1 a Sell. Ticker Nerd's systematic factor model ranks General Dynamics Corp. 94 out of 100 across roughly 4,600 US stocks as at 8 Sept 2026. None of this is personal advice — it does not consider your circumstances.

How does Ticker Nerd's model rank GD?

As at 8 Sept 2026, General Dynamics Corp. ranks 94 out of 100 on Ticker Nerd's systematic factor model — a percentile across roughly 4,600 US stocks, built from its factor families. Its strongest factor family is Volatility (98 of 100).

Will GD stock go up?

No one can know that. What the data says: the median 12-month target from 24 analysts implies +21.9% from the last close, and Ticker Nerd's factor model ranks General Dynamics Corp. 94 out of 100 as at 8 Sept 2026. Analyst targets are third-party estimates and frequently wrong; none of this is personal advice.

What is the GD stock forecast for 2030?

No analyst covering General Dynamics Corp. publishes a 2030 price target — Wall Street targets run 12 to 18 months out. Sites quoting a 2030 price for GD are extrapolating price history, which says nothing about the business. The furthest attributed numbers are the current analyst targets: $319 to $465 over the next 12 months.

How has GD stock performed over the past year?

General Dynamics Corp. returned +11.7% over the 12 months to 9 Sept 2026, with dividends reinvested. Past performance does not indicate future returns.

What does General Dynamics Corp. do?

General Dynamics Corp. is a global aerospace and defense company that designs, engineers, and manufactures products and services for government and commercial customers.

What is the latest news on GD?

The most recent item we track (Zacks Investment Research, 9 Sept 2026): "General Dynamics (GD) Falls More Steeply Than Broader Market: What Investors Need to Know". General Dynamics (GD) shares closed at $352.67 in the most recent trading day, down 1.1% from the prior session, a steeper decline than the broader market.

Company

About General Dynamics Corp.

General Dynamics Corp. is a global aerospace and defense company that designs, engineers, and manufactures products and services for government and commercial customers. Its operations are organized across four main business segments: Aerospace, Marine Systems, Combat Systems, and Technologies. The company’s portfolio includes business jets, nuclear-powered submarines, surface ships, combat vehicles, weapons systems, munitions, and mission-support technology solutions. It also provides information technology, command-and-control, cybersecurity, and C4ISR capabilities for defense and federal clients. General Dynamics serves a broad range of markets tied to aviation, naval construction, land combat systems, and secure communications, making it a diversified supplier across multiple defense and high-technology industries. Headquartered in Reston, Virginia, General Dynamics is a major contractor in the global security and aerospace market.

CEO Ms. Phebe N. Novakovic · 117,000 employees · United States · https://www.gd.com