GYREGYREHealthcare · Biotechnology

GYRE Stock Forecast: Gyre Therapeutics, Inc. Price Predictions for 2026-2027

Last close, 14 Aug 2026
$6.68
+2.14% on the day

The 3 Wall Street analysts covering Gyre Therapeutics, Inc. hold a median 12-month price target of $18 — +169.5% from the last close. Ticker Nerd's systematic factor model, run across ~4,600 US stocks, ranks it 39 of 100 as at 15 Aug 2026 — in the lower half. The Street sees upside; the factor read is a caution. That gap is the story on this page.

Market cap
$708.3M
Ticker Nerd rank
39 / 100
Median analyst target
$18
Analysts covering
3
Total return, dividends reinvested
1W
+0.1%
1M
+5.4%
YTD
−5.4%
1Y
−18.7%
From 52W high
−24.7%
From 52W low
+20.1%
$5.56
$8.87
52-week range, adjusted closes · the dot is the last close
Ticker Nerd rank

GYRE stock analysis: one number for the whole business

Consensus tells you what everyone already believes. The model scores Gyre Therapeutics, Inc. on its factor families — the same systematic rank behind the Ticker Nerd portfolio.

Where the model ranks itAs at 15 Aug 2026
39 / 100

Percentile across ~4,600 US stocks on Ticker Nerd’s systematic factor model. Higher is better. How the model is built and tested

Value
92
Quality
89
Size
49
Growth
49
Volatility
46
Revisions
40
Accruals
27
Momentum
22
Issuance
17

Value (92): The shares cost little relative to the profits and assets behind them — which can mean the market is too gloomy, or that the business really is in trouble.

Issuance (17): The company has been issuing shares or taking on financing, diluting existing holders.

Built and run by Aslam Ghouse, an ex-Goldman Sachs quant trader with fourteen years in markets.

Wall Street

GYRE stock forecast 2026-2027: analyst price targets & predictions

The bullish and bearish analyst opinions on GYRE, reported as data — targets and ratings, the market's view beside the model's.

Share price and the analyst range, 12 monthsAdjusted close, US dollars
$5.00$10.00$15.00$20.00Oct 25Jan 26Apr 26Jul 26GYREHigh $20Median $18Low $18

Price targets and ratings are third-party analyst estimates, reported here as data. They are not Ticker Nerd forecasts, and they are frequently wrong.

What Wall Street says3 analysts
3 Buy0 Hold0 Sell
Low $18Median $18High $20

The green dot is the last close — the median target sits +169.5% from it.

Recent analyst actionsNewest first
DateFirmActionRatingTarget
10 Oct 2025JefferiesInitiatesBuy
10 Oct 2025JefferiesInitiatesBuy$16
26 Aug 2025HC Wainwright & Co.InitiatesBuy

Price targets and ratings are third-party analyst estimates, reported here as data. They are not Ticker Nerd forecasts, and they are frequently wrong.

Market Radar

This page is one stock. Monday covers all of them.

Computed off the Friday close and sent before the US open.

Market Radar reports the week’s largest rank changes across roughly 4,600 US stocks, the factor behind each one, and where the market went. GYRE appears on the weeks it earns a place.

Free, every Monday. Unsubscribe any time.

Estimates

GYRE analyst estimate revisions

Not the forecast itself — the direction analysts are revising it. Revision direction is one of the model's factor families.

Which way the estimates are movingNext fiscal year
EPS revision, 90 days
−258.2%
Analysts raising
0
Analysts cutting
3
Fundamentals

Gyre Therapeutics, Inc. (GYRE) financial data

A margin means little on its own. Each bar marks where the figure sits across the whole US universe we score.

Valuation
Trailing P/E
364.5×

Cheaper than 2% of US stocks

Price / sales
6.4×

Cheaper than 21% of US stocks

Price / book
6.6×

Cheaper than 17% of US stocks

EV / EBITDA
−57.2×

Cheaper than 94% of US stocks

Growth & margins
Revenue growth (YoY)
−2.1%

Higher than 24% of US stocks

Earnings growth (YoY)
8.7%

Higher than 46% of US stocks

Gross margin
92.4%

Higher than 97% of US stocks

Operating margin
−47.6%

Higher than 17% of US stocks

Net margin
−19.3%

Higher than 16% of US stocks

Returns & dividend
Return on equity
−17.4%

Higher than 32% of US stocks

Return on assets
−5.4%

Higher than 31% of US stocks

Dividend yield

Bars mark the percentile across the ~4,600 US stocks Ticker Nerd covers, among those reporting the figure.

Peers

GYRE vs competitors

The nearest names by industry and size, scored by the same model — like for like.

Its peer group, ranked by the same modelBiotechnology
CompanyMarket capTKN rank
GYREGyre Therapeutics, Inc.$708.3M
39
STTKShattuck Labs, Inc.$744.7M
76
DRUGBright Minds Biosciences, Inc.$743.9M
44
PHATPhathom Pharmaceuticals, Inc.$750.1M
80
MNPRMonopar Therapeutics, Inc.$755.4M
56
CTMXCytomX Therapeutics, Inc.$726.4M
51
BBOTBridgebio Oncology Therapeutics, Inc.$717.5M
12

Look up any of the roughly 4,600 stocks we score.

The rank is the raw material. Whether the rules would actually own Gyre Therapeutics, Inc. — and when they’d sell — is the membership. See the Ticker Nerd 20 →

News

Latest GYRE news & analysis

Gyre Therapeutics, Inc. (GYRE) Reports Q2 Loss, Beats Revenue Estimates

Zacks Investment Research · 7 Aug 2026negative

Gyre Therapeutics (GYRE) reported a Q2 loss of $0.12 per share, wider than the Zacks Consensus Estimate of a $0.08 loss and a decline from earnings of $0.02 per share a year earlier. The company did beat revenue estimates for the quarter.

Why it matters — GYRE watchers would track this quarterly result as it shows a loss exceeding analyst expectations and a sharp reversal from year-ago profitability, even though revenue came in ahead of estimates.

Gyre Therapeutics Reports Second Quarter 2026 and Year-to-Date Financial Results and Provides Business Update

GlobeNewsWire · 7 Aug 2026positive

Gyre Therapeutics reported second-quarter 2026 revenue of $29.1 million with a GAAP basic EPS of $(0.12), affirmed its full-year 2026 revenue guidance of $100.5–$111.0 million, and noted that China's CDE accepted an NDA for F351 (hydronidone) for CHB-induced liver fibrosis in May 2026. The company also highlighted the acquisition of Cullgen, including its degrader pipeline, and increased sales from its Gyre Pharmaceuticals division.

Why it matters — The NDA acceptance for F351 adds a second major product candidate after ETUARY while affirmed guidance and growing Gyre Pharmaceuticals sales signal ongoing commercial progress for GYRE watchers.

FAQ

Frequently asked questions about GYRE stock

What is the GYRE stock price forecast for 2026-2027?

The 3 Wall Street analysts covering Gyre Therapeutics, Inc. have a median 12-month price target of $18, with estimates ranging from $18 to $20. These are third-party analyst estimates, not Ticker Nerd forecasts, and they are frequently wrong.

Is GYRE stock a buy right now?

Of the 3 analysts covering Gyre Therapeutics, Inc., 3 rate it a Buy, 0 a Hold and 0 a Sell. Ticker Nerd's systematic factor model ranks Gyre Therapeutics, Inc. 39 out of 100 across roughly 4,600 US stocks as at 15 Aug 2026. None of this is personal advice — it does not consider your circumstances.

How does Ticker Nerd's model rank GYRE?

As at 15 Aug 2026, Gyre Therapeutics, Inc. ranks 39 out of 100 on Ticker Nerd's systematic factor model — a percentile across roughly 4,600 US stocks, built from its factor families. Its strongest factor family is Value (92 of 100).

Will GYRE stock go up?

No one can know that. What the data says: the median 12-month target from 3 analysts implies +169.5% from the last close, and Ticker Nerd's factor model ranks Gyre Therapeutics, Inc. 39 out of 100 as at 15 Aug 2026. Analyst targets are third-party estimates and frequently wrong; none of this is personal advice.

What is the GYRE stock forecast for 2030?

No analyst covering Gyre Therapeutics, Inc. publishes a 2030 price target — Wall Street targets run 12 to 18 months out. Sites quoting a 2030 price for GYRE are extrapolating price history, which says nothing about the business. The furthest attributed numbers are the current analyst targets: $18 to $20 over the next 12 months.

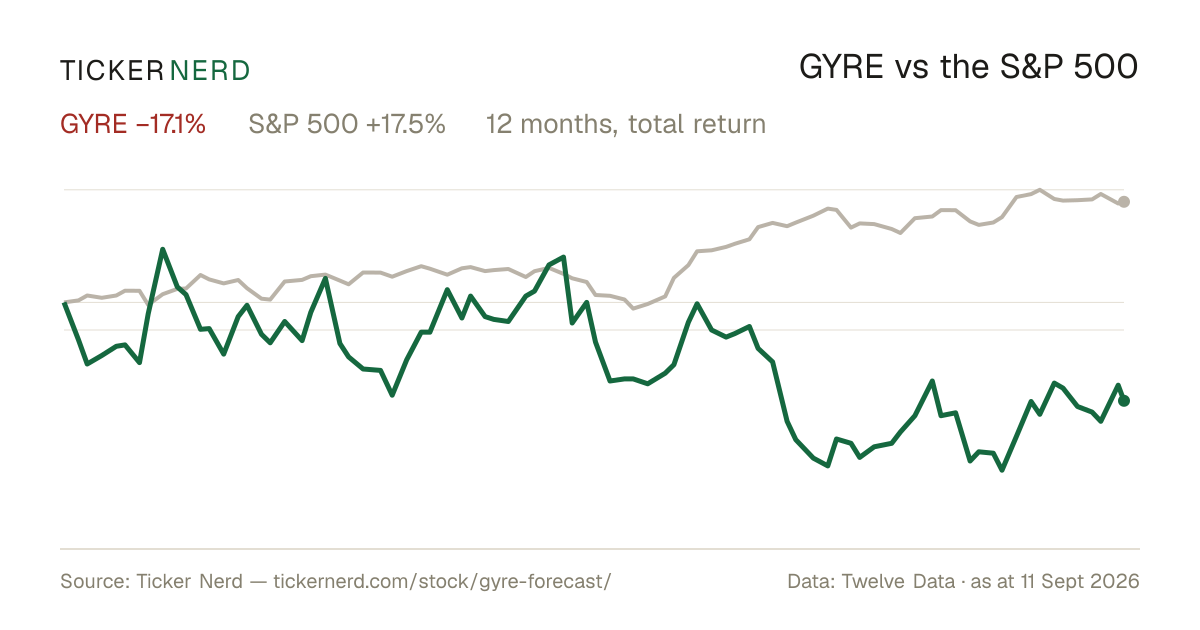
How has GYRE stock performed over the past year?

Gyre Therapeutics, Inc. returned -18.7% over the 12 months to 14 Aug 2026, with dividends reinvested. Past performance does not indicate future returns.

What does Gyre Therapeutics, Inc. do?

Gyre Therapeutics Inc. is a biotechnology firm dedicated to the discovery and development of innovative therapies for unmet medical needs.

What is the latest news on GYRE?

The most recent item we track (Zacks Investment Research, 7 Aug 2026): "Gyre Therapeutics, Inc. (GYRE) Reports Q2 Loss, Beats Revenue Estimates". Gyre Therapeutics (GYRE) reported a Q2 loss of $0.12 per share, wider than the Zacks Consensus Estimate of a $0.08 loss and a decline from earnings of $0.02 per share a year earlier. The company did beat revenue estimates for the quarter.

Company

About Gyre Therapeutics, Inc.

Gyre Therapeutics Inc. is a biotechnology firm dedicated to the discovery and development of innovative therapies for unmet medical needs. Its primary function is to leverage cutting-edge research and development technologies to address complex diseases and conditions that currently lack effective treatments. Gyre Therapeutics operates within the healthcare and biomedical sectors, impacting areas such as oncology, neurology, and rare genetic disorders. The company employs a robust pipeline strategy, focusing on both in-house R&D and collaborative partnerships to accelerate drug development and facilitate clinical trials. Through strategic alliances with academic institutions and pharmaceutical companies, Gyre Therapeutics aims to enhance its scientific capabilities and expand its therapeutic portfolio. As a specialized entity in the biotech industry, Gyre Therapeutics plays a crucial role in advancing medical science, potentially transforming patient care by bringing novel bio-pharmaceutical products to the market.

CEO Dr. Ying Luo Ph.D. · 625 employees · United States · https://www.gyretx.com