HUBSHUBSTechnology · Software - Application

HUBS Stock Forecast: HubSpot, Inc. Price Predictions for 2026-2027

Last close, 5 Oct 2026
$221
+2.83% on the day

The 34 Wall Street analysts covering HubSpot, Inc. hold a median 12-month price target of $250 — +13.3% from the last close. Ticker Nerd's systematic factor model, run across ~4,600 US stocks, ranks it 92 of 100 as at 5 Oct 2026 — among the strongest tenth. Here, the model and the Street point the same way.

Market cap
$11.0B
Ticker Nerd rank
92 / 100
Median analyst target
$250
Analysts covering
34
Revenue$911.7M+19.8% y/y
Operating income$44.4M
Net income$43.3M
Free cash flow$163.2M
Quarterly, 8 quarters to 30 June 2026 · latest quarter's figure shown
Total return, dividends reinvested
1W
+8.8%
1M
−10.9%
YTD
−45.0%
1Y
−51.2%
From 52W high
−55.4%
From 52W low
+29.6%
$170
$495
52-week range, adjusted closes · the dot is the last close
Ticker Nerd rank

HUBS stock analysis: one number for the whole business

Consensus tells you what everyone already believes. The model scores HubSpot, Inc. on its factor families — the same systematic rank behind the Ticker Nerd portfolio.

Where the model ranks itAs at 5 Oct 2026
92 / 100

Percentile across ~4,600 US stocks on Ticker Nerd’s systematic factor model. Higher is better. How the model is built and tested

Accruals
95
Quality
94
Issuance
92
Value
87
Growth
80
Revisions
76
Volatility
68
Size
15
Momentum
9

Accruals (95): Reported profit is backed by cash, and the company is not expanding recklessly.

Momentum (9): The shares have been drifting down relative to others.

Built and run by Aslam Ghouse, an ex-Goldman Sachs quant trader with fourteen years in markets.

Wall Street

HUBS stock forecast 2026-2027: analyst price targets & predictions

The bullish and bearish analyst opinions on HUBS, reported as data — targets and ratings, the market's view beside the model's.

Share price and the analyst range, 12 monthsAdjusted close, US dollars
$200$300$400$500Jan 26Apr 26Jul 26Oct 26HUBSHigh $320Median $250Low $190

Price targets and ratings are third-party analyst estimates, reported here as data. They are not Ticker Nerd forecasts, and they are frequently wrong.

Data provided by Twelve Data

What Wall Street says34 analysts
14 Buy19 Hold1 Sell
Low $190Median $250High $320

The green dot is the last close — the median target sits +13.3% from it.

Recent analyst actionsNewest first

Of the 20 most recent actions, 6 moved their price target up and 4 moved it down.

DateFirmActionRatingTarget
21 Sept 2026BMO CapitalMaintainsMarket Perform$215 → $250
21 Sept 2026Stephens & Co.MaintainsEqual-Weight$251 → $255
21 Sept 2026Truist SecuritiesMaintainsBuy$230 → $275
18 Sept 2026BTIGReiteratesBuy$250
18 Sept 2026Cantor FitzgeraldReiteratesNeutral$200
18 Sept 2026NeedhamReiteratesBuy$300
18 Sept 2026RBC CapitalReiteratesOutperform$300
18 Sept 2026TD CowenMaintainsHold$285 → $260
18 Sept 2026UBSMaintainsBuy$250 → $290
11 Sept 2026RBC CapitalReiteratesOutperform—
11 Sept 2026RBC CapitalReiteratesOutperform$300
11 Sept 2026StifelMaintainsHold$200 → $225
11 Sept 2026StifelMaintainsHold—
1 Sept 2026TD CowenMaintainsHold$220 → $285
1 Sept 2026TD CowenMaintainsHold—
7 Aug 2026BMO CapitalDowngradeMarket Perform—
7 Aug 2026BMO CapitalDowngradeMarket Perform$230 → $215
7 Aug 2026CitigroupMaintainsNeutral—
7 Aug 2026CitigroupMaintainsNeutral$217 → $210
6 Aug 2026BarclaysMaintainsOverweight$270 → $240

Price targets and ratings are third-party analyst estimates, reported here as data. They are not Ticker Nerd forecasts, and they are frequently wrong.

Market Radar

This page is one stock. Monday covers all of them.

Computed off the Friday close and sent before the US open.

Market Radar reports the week’s largest rank changes across roughly 4,600 US stocks, the factor behind each one, and where the market went. HUBS appears on the weeks it earns a place.

Free, every Monday. Unsubscribe any time.

Performance

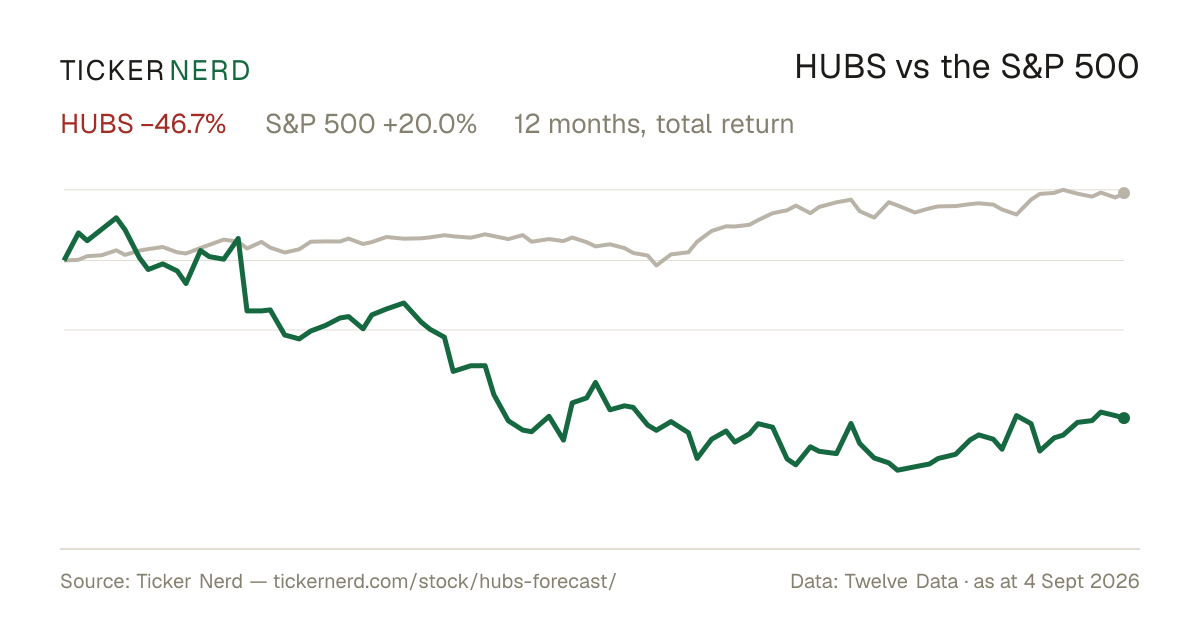
HUBS vs the S&P 500

Both lines are total return — dividends reinvested — so the comparison is honest on both sides.

Over the twelve months to 5 Oct 2026, HubSpot, Inc. returned −51.2% against +17.0% for the S&P 500, dividends included.

HUBS vs S&P 500, last 12 monthsTotal return, rebased to 100
406080100120Jan 26Apr 26Jul 26Oct 26HUBSS&P 500

Download this chart as an image — free to reuse; link this page as the source.

Data provided by Twelve Data

Estimates

HUBS analyst estimate revisions

Not the forecast itself — the direction analysts are revising it. Revision direction is one of the model's factor families.

Which way the estimates are movingNext fiscal year
EPS revision, 90 days
+1.5%
Analysts raising
2
Analysts cutting
0
Fundamentals

HubSpot, Inc. (HUBS) financial data

A margin means little on its own. Each bar marks where the figure sits across the whole US universe we score.

Valuation
Trailing P/E
76.3×

Cheaper than 9% of US stocks

Price / sales
3.2×

Cheaper than 38% of US stocks

Price / book
6.4×

Cheaper than 15% of US stocks

EV / EBITDA
61.3×

Cheaper than 4% of US stocks

Growth & margins
Revenue growth (YoY)
19.8%

Higher than 69% of US stocks

Earnings growth (YoY)
19.8%

Higher than 58% of US stocks

Gross margin
82.4%

Higher than 92% of US stocks

Operating margin
4.9%

Higher than 54% of US stocks

Net margin
4.3%

Higher than 58% of US stocks

Returns & dividend
Return on equity
7.9%

Higher than 58% of US stocks

Return on assets
2.4%

Higher than 61% of US stocks

Dividend yield
—

Bars mark the percentile across the ~4,600 US stocks Ticker Nerd covers, among those reporting the figure.

Key statistics

HubSpot, Inc. (HUBS) statistics: revenue, profit & scale

The headline figures, each with its date. Every row carries its own link — cite it straight from here.

  • HubSpot, Inc. has a market value of $11.0B and an enterprise value of $9.6B.

  • Revenue in the twelve months to 30 June 2026: $3.4B. The latest quarter grew 19.8% year on year.

  • Net income over the same four quarters: $146.9M, a 4.3% net margin.

  • Diluted earnings per share, trailing twelve months: $2.83.

  • Free cash flow in the twelve months to 30 June 2026: $657.9M, after $139.1M of capital spending.

  • HubSpot, Inc. spent $1.1B on share buybacks in the twelve months to 30 June 2026.

  • Shares outstanding: 49.7M.

  • Trailing P/E: 76.3×; forward P/E: 12.7× — the forward figure prices analyst consensus estimates, not reported earnings.

  • HubSpot, Inc. employs 9,016 people — $383K of revenue per employee.

Statement figures: company filings via Twelve Data, four quarters to 30 June 2026 · market figures as at 6 Oct 2026

Data provided by Twelve Data

Peers

HUBS vs competitors

The nearest names by industry and size, scored by the same model — like for like.

Its peer group, ranked by the same modelSoftware - Application
CompanyMarket capTKN rank
HUBSHubSpot, Inc.$11.0B
92
CHYMChime Financial, Inc.$10.9B
44
BSYBentley Systems, Inc.$10.5B
69
FIGFigma, Inc.$11.5B
21
FROGJFrog Ltd.$11.6B
71
QNTQuantinuum, Inc.$11.8B
0
PAYCPaycom Software, Inc.$10.0B
82

Look up any of the roughly 4,600 stocks we score.

The rank is the raw material. Whether the rules would actually own HubSpot, Inc. — and when they’d sell — is the membership. See the Ticker Nerd 20 →

News

Latest HUBS news & analysis

This HubSpot Analyst Is No Longer Bullish; Here Are Top 5 Downgrades For Monday

Benzinga · 5 Oct 2026negative

A Wall Street analyst covering HubSpot has changed their outlook and is no longer bullish, marking one of the top five analyst downgrades for Monday. This reflects an altered stance on the company among top analysts.

Why it matters — A downgrade from a previously bullish analyst signals a shift in sentiment that HUBS watchers would note when assessing the stock.

Atlassian Climbs 6% as Beaten-Down Software Names Bounce; HubSpot and Monday.com Gain 4%

24/7 Wall Street · 1 Oct 2026positive

Shares of Atlassian gained 6% in a rebound among beaten-down work management software stocks, while rivals HubSpot and Monday.com advanced about 4% each. Atlassian shares were trading at $189.

Why it matters — HubSpot watchers would note that the sector-wide bounce also lifted HubSpot's shares, indicating improving sentiment across work management software peers.

HubSpot Valuation: SaaS-Pocalypse Discount And DCF Imply More Upside

Seeking Alpha · 1 Oct 2026positive

A Seeking Alpha analysis argues that HubSpot's valuation has fallen to historic lows following the "SaaS-pocalypse," with forward P/E and P/S well below historical averages. The article contends that fears of AI-driven CRM obsolescence are overblown, as small businesses rely on established platforms like HubSpot, and cites record new business formation and strong Rule of 40 metrics as supporting a robust growth outlook.

Why it matters — HUBS watchers would care because the piece challenges bearish sentiment on AI disruption and suggests the market may be underpricing the company's growth prospects at historically low valuation multiples.

HubSpot's Co-Founder Sells 8,500 Shares for $2.1 Million After a 52% One-Year Stock Price Decline

The Motley Fool · 28 Sept 2026negative

HubSpot's co-founder sold 8,500 shares at $245.64 per share, totaling approximately $2.1 million. The sale represented 2% of the seller's total equity holdings before the transaction, and follows a 52% one-year decline in the company's stock price.

Why it matters — HUBS watchers would care because an insider sale by a co-founder amid a significant stock price decline may draw attention to insider sentiment and the stock's recent performance.

Software's Recovery Is Still Loading

Seeking Alpha · 25 Sept 2026neutral

The iShares Software ETF has rallied 43% since September 2025, rising back above its 50- and 200-day moving averages, though it remains 9.4% below its September peak. The recovery back to prior highs has been gradual and incomplete.

Why it matters — As a software company, HubSpot's performance is closely tied to the broader software sector's recovery trajectory reflected in this ETF.

FAQ

Frequently asked questions about HUBS stock

What is the HUBS stock price forecast for 2026-2027?

The 34 Wall Street analysts covering HubSpot, Inc. have a median 12-month price target of $250, with estimates ranging from $190 to $320. These are third-party analyst estimates, not Ticker Nerd forecasts, and they are frequently wrong.

Is HUBS stock a buy right now?

Of the 34 analysts covering HubSpot, Inc., 14 rate it a Buy, 19 a Hold and 1 a Sell. Ticker Nerd's systematic factor model ranks HubSpot, Inc. 92 out of 100 across roughly 4,600 US stocks as at 5 Oct 2026. None of this is personal advice — it does not consider your circumstances.

How does Ticker Nerd's model rank HUBS?

As at 5 Oct 2026, HubSpot, Inc. ranks 92 out of 100 on Ticker Nerd's systematic factor model — a percentile across roughly 4,600 US stocks, built from its factor families. Its strongest factor family is Accruals (95 of 100).

Will HUBS stock go up?

No one can know that. What the data says: the median 12-month target from 34 analysts implies +13.3% from the last close, and Ticker Nerd's factor model ranks HubSpot, Inc. 92 out of 100 as at 5 Oct 2026. Analyst targets are third-party estimates and frequently wrong; none of this is personal advice.

What is the HUBS stock forecast for 2030?

No analyst covering HubSpot, Inc. publishes a 2030 price target — Wall Street targets run 12 to 18 months out. Sites quoting a 2030 price for HUBS are extrapolating price history, which says nothing about the business. The furthest attributed numbers are the current analyst targets: $190 to $320 over the next 12 months.

How has HUBS stock performed over the past year?

HubSpot, Inc. returned -51.2% over the 12 months to 5 Oct 2026, with dividends reinvested. Past performance does not indicate future returns.

What does HubSpot, Inc. do?

HubSpot, Inc. Common Stock represents HubSpot, a cloud-based customer relationship management software company that serves businesses across marketing, sales, service, operations, and content management.

What is the latest news on HUBS?

The most recent item we track (Benzinga, 5 Oct 2026): "This HubSpot Analyst Is No Longer Bullish; Here Are Top 5 Downgrades For Monday". A Wall Street analyst covering HubSpot has changed their outlook and is no longer bullish, marking one of the top five analyst downgrades for Monday. This reflects an altered stance on the company among top analysts.

Company

About HubSpot, Inc.

HubSpot, Inc. Common Stock represents HubSpot, a cloud-based customer relationship management software company that serves businesses across marketing, sales, service, operations, and content management. HubSpot’s platform brings together tools for lead generation, customer engagement, workflow automation, analytics, and native payment capabilities, helping organizations manage the full customer lifecycle in one system. The company’s products are used by businesses of varying sizes to support inbound marketing, sales productivity, customer support, and operational coordination. HubSpot also offers integrations and add-on services that extend the platform across different teams and use cases. As a provider of integrated CRM software, HubSpot occupies a significant position in the application software market and is widely recognized for its unified approach to customer-facing business operations.

CEO Ms. Yamini Rangan · 9,016 employees · United States · https://www.hubspot.com