KNDIKNDIConsumer Cyclical · Recreational Vehicles

KNDI Stock Forecast: Kandi Technologies Group, Inc. Price Predictions for 2026-2027

Last close, 18 Sept 2026
$0.52
−5.35% on the day

Ticker Nerd's systematic factor model, run across ~4,600 US stocks, ranks it 3 of 100 as at 17 Sept 2026 — in the weakest quartile.

Market cap
$58.8M
Ticker Nerd rank
3 / 100
Median analyst target
Analysts covering
0
Revenue$37.8M+3.8% y/y
Operating income−$33.1M
Net income−$49.2M
Quarterly, 6 quarters to 31 Dec 2024 · latest quarter's figure shown
Total return, dividends reinvested
1W
−14.7%
1M
−17.4%
YTD
−34.1%
1Y
−62.3%
From 52W high
−62.3%
From 52W low
0.0%
$0.52
$1.38
52-week range, adjusted closes · the dot is the last close
Ticker Nerd rank

KNDI stock analysis: one number for the whole business

Consensus tells you what everyone already believes. The model scores Kandi Technologies Group, Inc. on its factor families — the same systematic rank behind the Ticker Nerd portfolio.

Where the model ranks itAs at 17 Sept 2026
3 / 100

Percentile across ~4,600 US stocks on Ticker Nerd’s systematic factor model. Higher is better. How the model is built and tested

Size
81
Volatility
43
Momentum
33
Revisions
25
Accruals
8
Value
3
Quality
2
Growth
1
Issuance
0

Size (81): Smaller than most of the companies we track.

Issuance (0): The company has been issuing shares or taking on financing, diluting existing holders.

Built and run by Aslam Ghouse, an ex-Goldman Sachs quant trader with fourteen years in markets.

Wall Street

KNDI stock forecast 2026-2027: analyst price targets & predictions

The bullish and bearish analyst opinions on KNDI, reported as data — targets and ratings, the market's view beside the model's.

Share price and the analyst range, 12 monthsAdjusted close, US dollars
$0.40$0.60$0.80$1.00$1.20$1.40Oct 25Jan 26Apr 26Jul 26KNDI

Price targets and ratings are third-party analyst estimates, reported here as data. They are not Ticker Nerd forecasts, and they are frequently wrong.

Data provided by Twelve Data

Recent analyst actionsNewest first
DateFirmActionRatingTarget
2 Dec 2021Noble Capital MarketsInitiatesOutperform$5.00
2 Dec 2021Noble Capital MarketsInitiatesOutperform

Price targets and ratings are third-party analyst estimates, reported here as data. They are not Ticker Nerd forecasts, and they are frequently wrong.

Market Radar

This page is one stock. Monday covers all of them.

Computed off the Friday close and sent before the US open.

Market Radar reports the week’s largest rank changes across roughly 4,600 US stocks, the factor behind each one, and where the market went. KNDI appears on the weeks it earns a place.

Free, every Monday. Unsubscribe any time.

Performance

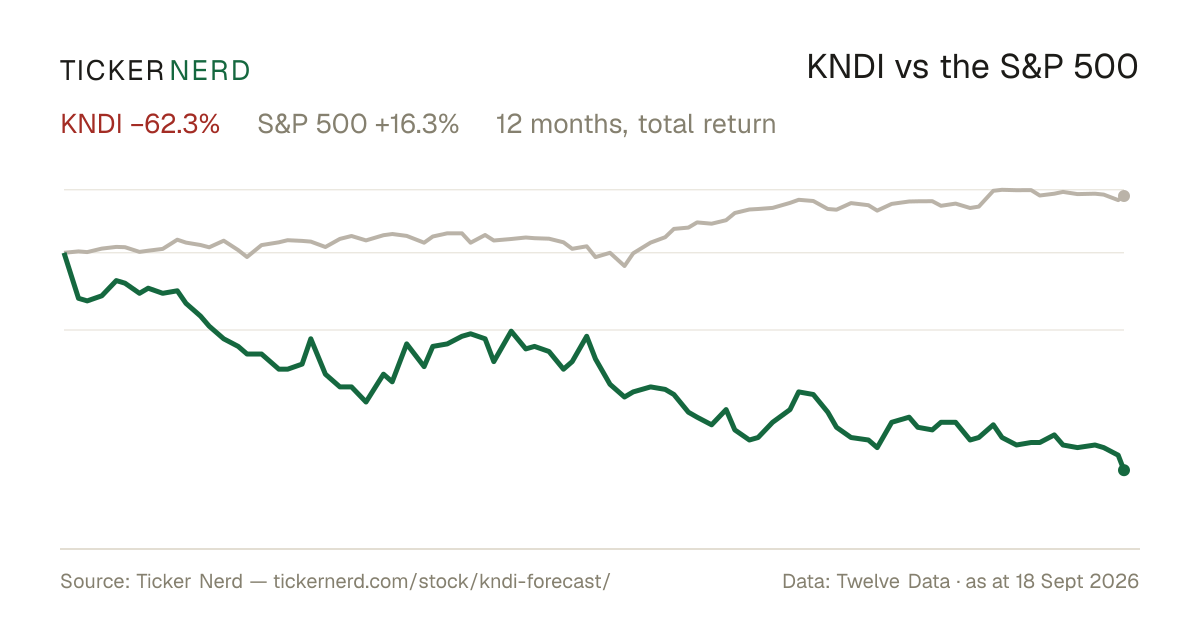
KNDI vs the S&P 500

Both lines are total return — dividends reinvested — so the comparison is honest on both sides.

Over the twelve months to 18 Sept 2026, Kandi Technologies Group, Inc. returned −62.3% against +16.3% for the S&P 500, dividends included.

KNDI vs S&P 500, last 12 monthsTotal return, rebased to 100
406080100120Oct 25Jan 26Apr 26Jul 26KNDIS&P 500

Download this chart as an image — free to reuse; link this page as the source.

Data provided by Twelve Data

Estimates

KNDI analyst estimate revisions

Not the forecast itself — the direction analysts are revising it. Revision direction is one of the model's factor families.

Fundamentals

Kandi Technologies Group, Inc. (KNDI) financial data

A margin means little on its own. Each bar marks where the figure sits across the whole US universe we score.

Valuation
Trailing P/E
107.0×

Cheaper than 7% of US stocks

Price / sales
0.7×

Cheaper than 77% of US stocks

Price / book
0.2×

Cheaper than 89% of US stocks

EV / EBITDA
1.1×

Cheaper than 58% of US stocks

Growth & margins
Revenue growth (YoY)
−32.3%

Higher than 8% of US stocks

Earnings growth (YoY)
3.8%

Higher than 40% of US stocks

Gross margin
28.9%

Higher than 32% of US stocks

Operating margin
−77.2%

Higher than 15% of US stocks

Net margin
−107.4%

Higher than 5% of US stocks

Returns & dividend
Return on equity
−31.0%

Higher than 27% of US stocks

Return on assets
−5.9%

Higher than 31% of US stocks

Dividend yield

Bars mark the percentile across the ~4,600 US stocks Ticker Nerd covers, among those reporting the figure.

Key statistics

Kandi Technologies Group, Inc. (KNDI) statistics: revenue, profit & scale

The headline figures, each with its date. Every row carries its own link — cite it straight from here.

  • Kandi Technologies Group, Inc. has a market value of $58.8M and an enterprise value of −$38.6M.

  • Revenue in the twelve months to 31 Dec 2024: $135.3M. The latest quarter shrank 32.3% year on year.

  • Net income over the same four quarters: −$56.3M, a −41.6% net margin.

  • Shares outstanding: 82.7M.

  • Trailing P/E: 107.0×; forward P/E: 3.9× — the forward figure prices analyst consensus estimates, not reported earnings.

  • Kandi Technologies Group, Inc. employs 595 people $227K of revenue per employee.

Statement figures: company filings via Twelve Data, four quarters to 31 Dec 2024 · market figures as at 17 Sept 2026

Data provided by Twelve Data

Peers

KNDI vs competitors

The nearest names by industry and size, scored by the same model — like for like.

Its peer group, ranked by the same modelRecreational Vehicles
CompanyMarket capTKN rank
KNDIKandi Technologies Group, Inc.$58.8M
3
MAMOMassimo Group$39.6M
69
EMPDEmpery Digital, Inc.$87.4M
7
LVWRLiveWire Group, Inc.$289.3M
24
MBUUMalibu Boats, Inc.$464.9M
54
MCFTMastercraft Boat Holdings, Inc.$491.9M
63
VEEETwin Vee PowerCats Co.$5.0M
28

Look up any of the roughly 4,600 stocks we score.

The rank is the raw material. Whether the rules would actually own Kandi Technologies Group, Inc. — and when they’d sell — is the membership. See the Ticker Nerd 20 →

News

Latest KNDI news & analysis

EV Charging Stocks Climb as Small Caps Catch a Bid: Blink Charging Jumps 6%, ChargePoint Rises 4%, EVgo Ticks Up

24/7 Wall Street · 16 Sept 2026neutral

Small-cap electric vehicle charging stocks rose Wednesday morning with no company-specific news to explain the move. Blink Charging jumped 6%, ChargePoint rose 4%, and EVgo ticked up.

Why it matters — As a small-cap EV-related company, KNDI may be affected by broader sector-wide moves in EV and EV-charging shares even when driven by market conditions rather than company news.

EV-Maker Polestar Says Trump Administration Strung It Along Before U.S. Ban

WSJ · 24 Aug 2026negative

Chinese-owned EV maker Polestar said the Trump administration strung it along before banning it from the U.S. market, and the company told dealers it is still trying to understand why it is being banned.

Why it matters — KNDI watchers would care because it reflects growing U.S. regulatory risk facing Chinese-owned auto and EV companies operating in the American market.

EV, Battery Sales Help Q2 Cleantech Investment Rebound

Forbes · 17 Aug 2026positive

Forbes reports that Q2 cleantech investment rebounded, aided by electric vehicle and battery sales. The item is part of the publication's weekly sustainability-business newsletter coverage.

Why it matters — As a company in the EV and battery space, KNDI may be affected by broader cleantech investment trends.

EV prices are rising again as automakers pull back on discounts

Business Insider · 14 Aug 2026positive

According to Kelley Blue Book, the average transaction price for EVs rose to $56,126 in July, a 1.6% increase compared to July 2025, as automakers reduce discounts.

Why it matters — Rising EV prices may signal improving pricing power across the electric vehicle industry, which could benefit Kandi Technologies as an EV manufacturer.

EV Investing: Why RIVN Faces Headwinds While TSLA Offers Upside

Schwab Network · 30 July 2026neutral

On Schwab Network, Henry Green of KraneShares discussed challenges for Rivian in the U.S. EV market, including the expiration of tax credits, and highlighted global EV opportunities including in China. The segment also covered a bullish options strategy for Tesla.

Why it matters — The discussion of global EV opportunities, particularly in China, is relevant for KNDI given its operations in the Chinese EV and battery sectors.

FAQ

Frequently asked questions about KNDI stock

How does Ticker Nerd's model rank KNDI?

As at 17 Sept 2026, Kandi Technologies Group, Inc. ranks 3 out of 100 on Ticker Nerd's systematic factor model — a percentile across roughly 4,600 US stocks, built from its factor families. Its strongest factor family is Size (81 of 100).

What is the KNDI stock forecast for 2030?

No analyst covering Kandi Technologies Group, Inc. publishes a 2030 price target — Wall Street targets run 12 to 18 months out. Sites quoting a 2030 price for KNDI are extrapolating price history, which says nothing about the business.

How has KNDI stock performed over the past year?

Kandi Technologies Group, Inc. returned -62.3% over the 12 months to 18 Sept 2026, with dividends reinvested. Past performance does not indicate future returns.

What does Kandi Technologies Group, Inc. do?

Kandi Technologies Group, Inc. is a China-based electric vehicle and mobility company focused on designing, manufacturing, and commercializing off-road electric vehicles and related products.

What is the latest news on KNDI?

The most recent item we track (24/7 Wall Street, 16 Sept 2026): "EV Charging Stocks Climb as Small Caps Catch a Bid: Blink Charging Jumps 6%, ChargePoint Rises 4%, EVgo Ticks Up". Small-cap electric vehicle charging stocks rose Wednesday morning with no company-specific news to explain the move. Blink Charging jumped 6%, ChargePoint rose 4%, and EVgo ticked up.

Company

About Kandi Technologies Group, Inc.

Kandi Technologies Group, Inc. is a China-based electric vehicle and mobility company focused on designing, manufacturing, and commercializing off-road electric vehicles and related products. Its current lineup includes all-terrain vehicles, utility vehicles, go-karts, electric scooters, and self-balancing scooters, along with EV parts, lithium-ion cells, battery packs, and battery swap systems. The company serves a mix of recreational, agricultural, and site-transportation uses, positioning its products for both consumer and commercial applications. Kandi Technologies Group also operates in international markets, including China, the United States, and other regions, through subsidiaries and distribution partners. Headquartered in Jinhua, Zhejiang, the company is known for combining electric mobility hardware with battery and energy-support technologies across its product portfolio.

CEO Mr. Feng Chen · 595 employees · China · https://www.kandigroup.com