MNSTMNSTConsumer Defensive · Beverages - Non-Alcoholic

MNST Stock Forecast: Monster Beverage Corp. Price Predictions for 2026-2027

Last close, 23 Oct 2026
$46
−2.35% on the day

The 25 Wall Street analysts covering Monster Beverage Corp. hold a median 12-month price target of $50 — +8.2% from the last close. Ticker Nerd's systematic factor model, run across ~4,600 US stocks, ranks it 80 of 100 as at 23 Oct 2026 — inside the top quartile. Here, the model and the Street point the same way.

Market cap
$92.7B
Ticker Nerd rank
80/ 100
Median analyst target
$50
Analysts covering
25
Revenue$2.5B+20.2% y/y
Operating income$740.4M
Net income$584.5M
Free cash flow$457.8M
Quarterly, 8 quarters to 30 June 2026 · latest quarter's figure shown
Total return, dividends reinvested
1W
+1.0%
1M
+5.2%
YTD
+20.5%
1Y
+32.2%
From 52W high
−7.6%
From 52W low
+39.3%
$33
$50
52-week range, adjusted closes · the dot is the last close
Ticker Nerd rank

MNST stock analysis: one number for the whole business

Consensus tells you what everyone already believes. The model scores Monster Beverage Corp. on its factor families — the same systematic rank behind the Ticker Nerd portfolio.

Where the model ranks itAs at 23 Oct 2026
80/ 100

Percentile across ~4,600 US stocks on Ticker Nerd’s systematic factor model. Higher is better. How the model is built and tested

Quality
97
Momentum
95
Revisions
89
Growth
78
Issuance
77
Volatility
68
Accruals
29
Value
26
Size
3

Quality (97): The business earns solid, repeatable profits on what it owns.

Value (26): The shares cost a lot relative to the profits and assets behind them.

Size (3): Larger than most of the companies we track — more scrutinised, less often mispriced.

Built and run by Aslam Ghouse, an ex-Goldman Sachs quant trader with fourteen years in markets.

Wall Street

MNST stock forecast 2026-2027: analyst price targets & predictions

The bullish and bearish analyst opinions on MNST, reported as data — targets and ratings, the market's view beside the model's.

Share price and the analyst range, 12 monthsAdjusted close, US dollars
$30$35$40$45$50$55$60Jan 26Apr 26Jul 26Oct 26MNSTHigh $57Median $50Low $35

Price targets and ratings are third-party analyst estimates, reported here as data. They are not Ticker Nerd forecasts, and they are frequently wrong.

Data provided by Twelve Data

What Wall Street says25 analysts
14 Buy10 Hold1 Sell
Low $35Median $50High $57

The green dot is the last close — the median target sits +8.2% from it.

Recent analyst actionsNewest first

Of the 20 most recent actions, 9 moved their price target up and 1 moved it down.

DateFirmActionRatingTarget
5 Oct 2026Wells FargoMaintainsOverweight$53 → $48
7 Aug 2026Evercore ISI GroupMaintainsOutperform—
7 Aug 2026Evercore ISI GroupMaintainsOutperform$95 → $105
7 Aug 2026Piper SandlerMaintainsOverweight$94 → $101
7 Aug 2026Piper SandlerMaintainsOverweight—
7 Aug 2026RBC CapitalMaintainsOutperform—
7 Aug 2026RBC CapitalMaintainsOutperform$97 → $100
7 Aug 2026UBSMaintainsNeutral$104 → $105
7 Aug 2026UBSMaintainsNeutral—
20 July 2026BMO CapitalMaintainsMarket Perform—
20 July 2026BMO CapitalMaintainsMarket Perform$73 → $95
20 July 2026Deutsche BankDowngradeHold—
20 July 2026Deutsche BankDowngradeHold$94 → $98
16 July 2026StifelMaintainsBuy$90 → $105
16 July 2026StifelMaintainsBuy—
16 July 2026UBSMaintainsNeutral$84 → $104
16 July 2026UBSMaintainsNeutral—
14 July 2026CitigroupMaintainsBuy—
14 July 2026CitigroupMaintainsBuy$100 → $113
8 July 2026Wells FargoMaintainsOverweight—

Price targets and ratings are third-party analyst estimates, reported here as data. They are not Ticker Nerd forecasts, and they are frequently wrong.

Market Radar

This page is one stock. Monday covers all of them.

MNST appears in the Radar on the weeks it earns a place.

  • Market Radar, every Monday: the week's biggest rank moves across ~4,600 US stocks, and the reason for each.
  • The AI build-out map, free: every AI company we track, part by part, and one part in full with each verdict.
  • The AI build-out, every Wednesday: how AI stocks did, part by part.

Free. Unsubscribe any time.

Performance

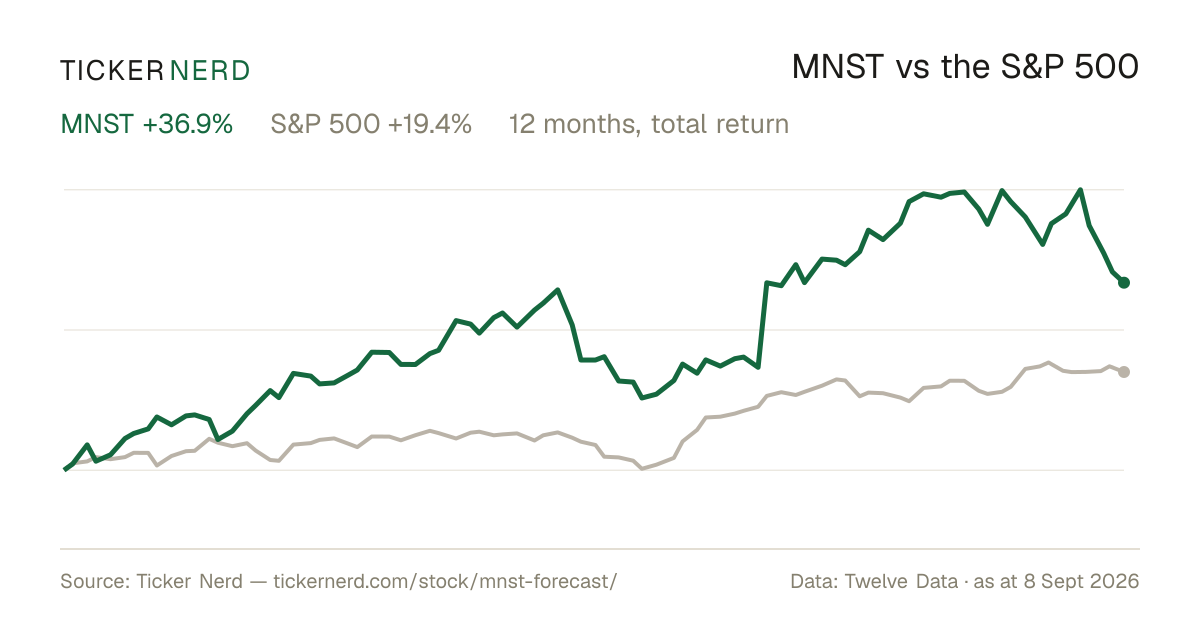
MNST vs the S&P 500

Both lines are total return — dividends reinvested — so the comparison is honest on both sides.

Over the twelve months to 23 Oct 2026, Monster Beverage Corp. returned +32.2% against +14.3% for the S&P 500, dividends included.

MNST vs S&P 500, last 12 monthsTotal return, rebased to 100
90100110120130140Jan 26Apr 26Jul 26Oct 26MNSTS&P 500

Download this chart as an image — free to reuse; link this page as the source.

Data provided by Twelve Data

Estimates

MNST analyst estimate revisions

Not the forecast itself — the direction analysts are revising it. Revision direction is one of the model's factor families.

Which way the estimates are movingNext fiscal year
EPS revision, 90 days
+1.5%
Analysts raising
1
Analysts cutting
1
Fundamentals

Monster Beverage Corp. (MNST) financial data

A margin means little on its own. Each bar marks where the figure sits across the whole US universe we score.

Valuation
Trailing P/E
43.0×

Cheaper than 17% of US stocks

Price / sales
10.1×

Cheaper than 14% of US stocks

Price / book
9.9×

Cheaper than 9% of US stocks

EV / EBITDA
30.5×

Cheaper than 8% of US stocks

Growth & margins
Revenue growth (YoY)
20.2%

Higher than 69% of US stocks

Earnings growth (YoY)
19.6%

Higher than 58% of US stocks

Gross margin
55.9%

Higher than 69% of US stocks

Operating margin
29.2%

Higher than 86% of US stocks

Net margin
23.1%

Higher than 84% of US stocks

Returns & dividend
Return on equity
25.7%

Higher than 85% of US stocks

Return on assets
17.5%

Higher than 98% of US stocks

Dividend yield
0.0%

Higher than 1% of US dividend payers

Bars mark the percentile across the ~4,600 US stocks Ticker Nerd covers, among those reporting the figure.

Key statistics

Monster Beverage Corp. (MNST) statistics: revenue, profit & scale

The headline figures, each with its date. Every row carries its own link — cite it straight from here.

  • Monster Beverage Corp. has a market value of $92.7B and an enterprise value of $89.3B.

  • Revenue in the twelve months to 30 June 2026: $9.2B. The latest quarter grew 20.2% year on year.

  • Net income over the same four quarters: $2.1B, a 23.1% net margin.

  • Diluted earnings per share, trailing twelve months: $1.08.

  • Free cash flow in the twelve months to 30 June 2026: $2.1B.

  • Monster Beverage Corp. spent $221.0M on share buybacks in the twelve months to 30 June 2026.

  • Shares outstanding: 2.0B.

  • Trailing P/E: 43.0×; forward P/E: 36.1× — the forward figure prices analyst consensus estimates, not reported earnings.

  • Forward dividend yield: 0.00%, paying out 0% of earnings.

  • Monster Beverage Corp. employs 5,773 people — $1.6M of revenue per employee.

Statement figures: company filings via Twelve Data, four quarters to 30 June 2026 · market figures as at 23 Oct 2026

Data provided by Twelve Data

Peers

MNST vs competitors

The nearest names by industry and size, scored by the same model — like for like.

Its peer group, ranked by the same modelBeverages - Non-Alcoholic
CompanyMarket capTKN rank
MNSTMonster Beverage Corp.$92.7B80
CCEPCoca-Cola Europacific Partners plc$49.8B74
KDPKeurig Dr Pepper, Inc.$47.2B39
PEPPepsiCo, Inc.$185.6B65
KOThe Coca-Cola Co.$398.8B91
COKECoca-Cola Consolidated, Inc.$13.5B68
CELHCelsius Holdings, Inc.$7.3B28

Look up any of the roughly 4,600 stocks we score.

The rank is the raw material. Whether the rules would actually own Monster Beverage Corp. — and when they’d sell — is the membership. See the Ticker Nerd 20 →

News

Latest MNST news & analysis

Monster Beverage Is Gaining Market Share in the Energy Drink Category

The Motley Fool · 21 Oct 2026positive

The Motley Fool reports that Monster Beverage is capitalizing on growth in the energy drink industry and gaining market share in the category.

Why it matters — The reported market-share gains and industry expansion are relevant to investors tracking Monster Beverage’s position in its category.

Kraft Heinz vs. Monster Beverage: Which Consumer Goods Stock Is a Better Buy in 2026?

The Motley Fool · 16 Oct 2026positive

The Motley Fool compares Kraft Heinz’s global footprint and nearly $25 billion in annual revenue with Monster Beverage’s double-digit revenue growth, nearly debt-free balance sheet, and expanding energy drink portfolio.

Why it matters — The comparison highlights Monster’s growth, financial position, and product expansion for investors following MNST.

Monster Beverage vs. PepsiCo: Which Consumer Goods Stock Is a Better Buy in 2026?

The Motley Fool · 15 Oct 2026neutral

The article compares Monster Beverage and PepsiCo, describing Monster's high revenue growth and robust net margins from its focus on energy drinks, and PepsiCo's defensive stability from its global footprint and diversified portfolio.

Why it matters — MNST watchers may find the comparison useful for understanding how Monster's category focus and financial characteristics contrast with PepsiCo's diversification.

e.l.f. Beauty vs. Monster Beverage: Which Consumer Goods Stock Is a Better Buy in 2026?

The Motley Fool · 13 Oct 2026neutral

The Motley Fool compared e.l.f. Beauty and Monster Beverage as consumer goods stocks in 2026. It noted e.l.f.’s digital expansion and retail presence, and Monster’s energy drink position and global distribution network.

Why it matters — The comparison highlights Monster’s distribution network and position in energy drinks for investors following MNST.

FAQ

Frequently asked questions about MNST stock

What is the MNST stock price forecast for 2026-2027?

The 25 Wall Street analysts covering Monster Beverage Corp. have a median 12-month price target of $50, with estimates ranging from $35 to $57. These are third-party analyst estimates, not Ticker Nerd forecasts, and they are frequently wrong.

Is MNST stock a buy right now?

Of the 25 analysts covering Monster Beverage Corp., 14 rate it a Buy, 10 a Hold and 1 a Sell. Ticker Nerd's systematic factor model ranks Monster Beverage Corp. 80 out of 100 across roughly 4,600 US stocks as at 23 Oct 2026. None of this is personal advice — it does not consider your circumstances.

How does Ticker Nerd's model rank MNST?

As at 23 Oct 2026, Monster Beverage Corp. ranks 80 out of 100 on Ticker Nerd's systematic factor model — a percentile across roughly 4,600 US stocks, built from its factor families. Its strongest factor family is Quality (97 of 100).

Will MNST stock go up?

No one can know that. What the data says: the median 12-month target from 25 analysts implies +8.2% from the last close, and Ticker Nerd's factor model ranks Monster Beverage Corp. 80 out of 100 as at 23 Oct 2026. Analyst targets are third-party estimates and frequently wrong; none of this is personal advice.

What is the MNST stock forecast for 2030?

No analyst covering Monster Beverage Corp. publishes a 2030 price target — Wall Street targets run 12 to 18 months out. Sites quoting a 2030 price for MNST are extrapolating price history, which says nothing about the business. The furthest attributed numbers are the current analyst targets: $35 to $57 over the next 12 months.

How has MNST stock performed over the past year?

Monster Beverage Corp. returned +32.2% over the 12 months to 23 Oct 2026, with dividends reinvested. Past performance does not indicate future returns.

What does Monster Beverage Corp. do?

Monster Beverage Corporation is a beverage company focused on developing, marketing, selling, and distributing energy drink beverages and concentrates. The company’s portfolio centers on ready-to-drink energy products, alongside strategic beverage brands and select alcohol offerings.

What is the latest news on MNST?

The most recent item we track (The Motley Fool, 22 Oct 2026): "e.l.f. Beauty vs. Monster Beverage: Here's What Their Revenue Trends Tell Investors About These High-Growth Consumer Companies". The comparison says Monster Beverage generated more revenue in absolute terms across the past eight quarters, while e.l.f. Beauty showed faster relative growth.

Company

About Monster Beverage Corp.

Monster Beverage Corporation is a beverage company focused on developing, marketing, selling, and distributing energy drink beverages and concentrates. The company’s portfolio centers on ready-to-drink energy products, alongside strategic beverage brands and select alcohol offerings. Its lineup includes Monster Energy and related brands such as Reign, Bang, Java Monster, Juice Monster, and Ultra, covering categories like performance energy, wellness-oriented drinks, coffee-based beverages, and flavored energy drinks. Monster Beverage also participates in adjacent nonalcoholic drinks, including still and sparkling waters, juices, teas, lemonades, and sports drinks through its broader brand assortment. The company serves consumers through bottlers, beverage distributors, and retail channels in the United States and internationally, making it a significant participant in the global nonalcoholic beverage market.

CEO Mr. Hilton H. Schlosberg · 5,773 employees · United States · https://www.monsterbevcorp.com