MOSMOSBasic Materials · Agricultural Inputs

MOS Stock Forecast: The Mosaic Co. Price Predictions for 2026-2027

Last close, 3 Sept 2026
$25
−1.12% on the day

The 20 Wall Street analysts covering The Mosaic Co. hold a median 12-month price target of $26 — +2.0% from the last close. Ticker Nerd's systematic factor model, run across ~4,600 US stocks, ranks it 17 of 100 as at 2 Sept 2026 — in the weakest quartile.

Market cap
$8.1B
Ticker Nerd rank
17 / 100
Median analyst target
$26
Analysts covering
20
Revenue$2.8B−6.0% y/y
Operating income−$29.3M
Net income−$265.5M
Free cash flow−$152.9M
Quarterly, 8 quarters to 30 June 2026 · latest quarter's figure shown
Total return, dividends reinvested
1W
+7.3%
1M
+16.9%
YTD
+7.8%
1Y
−19.3%
From 52W high
−27.1%
From 52W low
+28.6%
$20
$35
52-week range, adjusted closes · the dot is the last close
Ticker Nerd rank

MOS stock analysis: one number for the whole business

Consensus tells you what everyone already believes. The model scores The Mosaic Co. on its factor families — the same systematic rank behind the Ticker Nerd portfolio.

Where the model ranks itAs at 2 Sept 2026
17 / 100

Percentile across ~4,600 US stocks on Ticker Nerd’s systematic factor model. Higher is better. How the model is built and tested

Value
58
Accruals
57
Volatility
49
Issuance
43
Growth
32
Quality
30
Revisions
30
Size
18
Momentum
14

Value (58): The shares cost little relative to the profits and assets behind them — which can mean the market is too gloomy, or that the business really is in trouble.

Momentum (14): The shares have been drifting down relative to others.

Built and run by Aslam Ghouse, an ex-Goldman Sachs quant trader with fourteen years in markets.

Wall Street

MOS stock forecast 2026-2027: analyst price targets & predictions

The bullish and bearish analyst opinions on MOS, reported as data — targets and ratings, the market's view beside the model's.

Share price and the analyst range, 12 monthsAdjusted close, US dollars
$15$20$25$30$35Oct 25Jan 26Apr 26Jul 26MOSHigh $35Median $26Low $17

Price targets and ratings are third-party analyst estimates, reported here as data. They are not Ticker Nerd forecasts, and they are frequently wrong.

Data provided by Twelve Data

What Wall Street says20 analysts
9 Buy9 Hold2 Sell
Low $17Median $26High $35

The green dot is the last close — the median target sits +2.0% from it.

Recent analyst actionsNewest first
DateFirmActionRatingTarget
13 Aug 2026Freedom BrokerDowngradeSell$32$17
30 June 2026Morgan StanleyMaintainsEqual-Weight
30 June 2026Morgan StanleyMaintainsEqual-Weight$28$26
26 June 2026Rothschild & CoInitiatesBuy
26 June 2026Rothschild & CoInitiatesBuy$30
17 June 2026Freedom BrokerUpgradeBuy
21 May 2026BMO CapitalMaintainsOutperform
18 May 2026BarclaysMaintainsEqual-Weight
14 May 2026Wells FargoMaintainsEqual-Weight
13 May 2026RBC CapitalUpgradeOutperform
12 May 2026JP MorganMaintainsUnderweight
12 May 2026MizuhoMaintainsNeutral
12 May 2026UBSMaintainsNeutral
30 Apr 2026CIBCMaintainsNeutral
21 Apr 2026Wells FargoMaintainsEqual-Weight
20 Apr 2026ScotiabankMaintainsSector Outperform
26 Mar 2026UBSDowngradeNeutral
20 Mar 2026B of A SecuritiesDowngradeNeutral
17 Mar 2026CIBCMaintainsNeutral
3 Mar 2026BarclaysDowngradeEqual-Weight

Price targets and ratings are third-party analyst estimates, reported here as data. They are not Ticker Nerd forecasts, and they are frequently wrong.

Market Radar

This page is one stock. Monday covers all of them.

Computed off the Friday close and sent before the US open.

Market Radar reports the week’s largest rank changes across roughly 4,600 US stocks, the factor behind each one, and where the market went. MOS appears on the weeks it earns a place.

Free, every Monday. Unsubscribe any time.

Performance

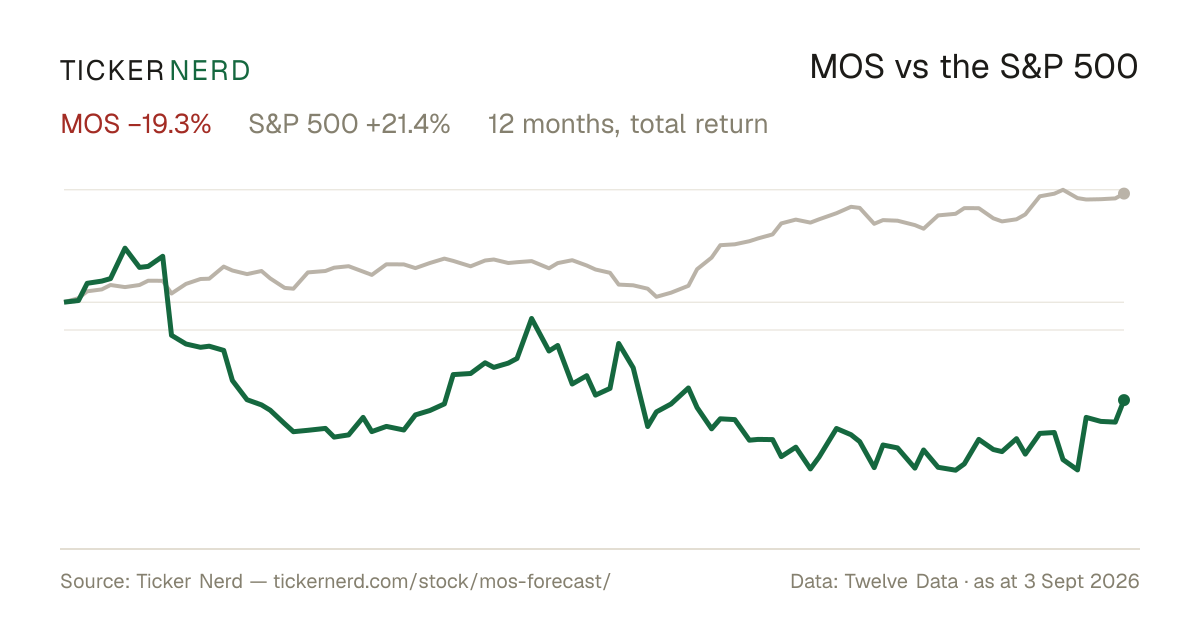
MOS vs the S&P 500

Both lines are total return — dividends reinvested — so the comparison is honest on both sides.

Over the twelve months to 3 Sept 2026, The Mosaic Co. returned −19.3% against +21.4% for the S&P 500, dividends included.

MOS vs S&P 500, last 12 monthsTotal return, rebased to 100
60708090100110120Oct 25Jan 26Apr 26Jul 26MOSS&P 500

Download this chart as an image — free to reuse; link this page as the source.

Data provided by Twelve Data

Estimates

MOS analyst estimate revisions

Not the forecast itself — the direction analysts are revising it. Revision direction is one of the model's factor families.

Which way the estimates are movingNext fiscal year
EPS revision, 90 days
−50.0%
Analysts raising
0
Analysts cutting
5
Fundamentals

The Mosaic Co. (MOS) financial data

A margin means little on its own. Each bar marks where the figure sits across the whole US universe we score.

Valuation
Trailing P/E
156.1×

Cheaper than 4% of US stocks

Price / sales
0.7×

Cheaper than 78% of US stocks

Price / book
0.7×

Cheaper than 82% of US stocks

EV / EBITDA
8.2×

Cheaper than 46% of US stocks

Growth & margins
Revenue growth (YoY)
−6.0%

Higher than 19% of US stocks

Earnings growth (YoY)
−6.0%

Higher than 29% of US stocks

Gross margin
7.6%

Higher than 8% of US stocks

Operating margin
−0.1%

Higher than 32% of US stocks

Net margin
−5.2%

Higher than 24% of US stocks

Returns & dividend
Return on equity
−5.1%

Higher than 39% of US stocks

Return on assets
1.2%

Higher than 52% of US stocks

Dividend yield
3.5%

Higher than 71% of US dividend payers

Bars mark the percentile across the ~4,600 US stocks Ticker Nerd covers, among those reporting the figure.

Key statistics

The Mosaic Co. (MOS) statistics: revenue, profit & scale

The headline figures, each with its date. Every row carries its own link — cite it straight from here.

  • The Mosaic Co. has a market value of $8.1B and an enterprise value of $14.1B.

  • Revenue in the twelve months to 30 June 2026: $12.2B. The latest quarter shrank 6.0% year on year.

  • Net income over the same four quarters: −$614.3M, a −5.0% net margin.

  • Diluted earnings per share, trailing twelve months: $−2.02.

  • Free cash flow in the twelve months to 30 June 2026: −$947.1M, after $1.4B of capital spending.

  • The Mosaic Co. spent $280.1M on dividends in the twelve months to 30 June 2026.

  • Shares outstanding: 317.9M.

  • Trailing P/E: 156.1×; forward P/E: 15.9× — the forward figure prices analyst consensus estimates, not reported earnings.

  • Forward dividend yield: 3.45%, paying out 629% of earnings.

  • The Mosaic Co. employs 13,000 people $942K of revenue per employee.

Statement figures: company filings via Twelve Data, four quarters to 30 June 2026 · market figures as at 4 Sept 2026

Data provided by Twelve Data

Peers

MOS vs competitors

The nearest names by industry and size, scored by the same model — like for like.

Its peer group, ranked by the same modelAgricultural Inputs
CompanyMarket capTKN rank
MOSThe Mosaic Co.$8.1B
17
ICLICL Group Ltd.$7.5B
61
SMGScotts Miracle-Gro Co.$3.5B
78
CFCF Industries Holdings, Inc.$22.0B
86
NTRNutrien Ltd.$38.3B
86
FMCFMC Corp.$1.7B
24
CTVACorteva, Inc.$60.2B
60

Look up any of the roughly 4,600 stocks we score.

The rank is the raw material. Whether the rules would actually own The Mosaic Co. — and when they’d sell — is the membership. See the Ticker Nerd 20 →

News

Latest MOS news & analysis

Why Is Mosaic (MOS) Up 10.1% Since Last Earnings Report?

Zacks Investment Research · 3 Sept 2026positive

Mosaic (MOS) last reported earnings 30 days ago, and its stock has risen 10.1% since that report. The item examines what may be next for the company following this earnings-driven price movement.

Why it matters — Mosaic watchers would follow this because the double-digit post-earnings stock gain signals notable investor response to the company's latest financial results.

2 Deeply Undervalued Stocks to Rent Now, Not Own Forever

Morningstar · 2 Sept 2026positive

Morningstar highlights two deeply undervalued no-moat stocks as attractive opportunities, describing them as too cheap to pass up. The article suggests these stocks are best suited for short-term investment periods rather than long-term ownership.

Why it matters — A MOS watcher would care because Mosaic, as a commodity producer, fits the profile of a no-moat stock that could be flagged among deeply undervalued opportunities in this type of analysis.

MOSAIC ANNOUNCES QUARTERLY DIVIDEND OF $0.22 PER SHARE

PRNewsWire · 27 Aug 2026neutral

The Mosaic Company announced that its Board of Directors declared a quarterly dividend of $0.22 per share on its common stock. The announcement was made on August 27, 2026.

Why it matters — A MOS watcher would care because the quarterly dividend declaration reflects the company's ongoing cash-return policy to shareholders.

MOS Launches Enzyme-Based Residue Management Product

Zacks Investment Research · 21 Aug 2026positive

Mosaic has launched Enzara, an enzyme-based residue management solution that operates at 32 degrees Fahrenheit to accelerate decomposition and help fields reach plant-ready conditions more quickly.

Why it matters — The new product expands Mosaic's agricultural solutions portfolio, potentially strengthening its offering to growers ahead of planting season.

Mosaic Biosciences Launches New Product to Accelerate Crop Residue Breakdown and Improve Spring Field Readiness

PRNewsWire · 17 Aug 2026positive

Mosaic Biosciences announced the launch of Renuvis Enzara, a residue management product designed to help growers accelerate the natural decomposition of heavy crop residue and reach plant-ready field conditions sooner.

Why it matters — This expands Mosaic's biosciences product portfolio, offering a new growth avenue for the company beyond its core fertilizer business.

FAQ

Frequently asked questions about MOS stock

What is the MOS stock price forecast for 2026-2027?

The 20 Wall Street analysts covering The Mosaic Co. have a median 12-month price target of $26, with estimates ranging from $17 to $35. These are third-party analyst estimates, not Ticker Nerd forecasts, and they are frequently wrong.

Is MOS stock a buy right now?

Of the 20 analysts covering The Mosaic Co., 9 rate it a Buy, 9 a Hold and 2 a Sell. Ticker Nerd's systematic factor model ranks The Mosaic Co. 17 out of 100 across roughly 4,600 US stocks as at 2 Sept 2026. None of this is personal advice — it does not consider your circumstances.

How does Ticker Nerd's model rank MOS?

As at 2 Sept 2026, The Mosaic Co. ranks 17 out of 100 on Ticker Nerd's systematic factor model — a percentile across roughly 4,600 US stocks, built from its factor families. Its strongest factor family is Value (58 of 100).

Will MOS stock go up?

No one can know that. What the data says: the median 12-month target from 20 analysts implies +2.0% from the last close, and Ticker Nerd's factor model ranks The Mosaic Co. 17 out of 100 as at 2 Sept 2026. Analyst targets are third-party estimates and frequently wrong; none of this is personal advice.

What is the MOS stock forecast for 2030?

No analyst covering The Mosaic Co. publishes a 2030 price target — Wall Street targets run 12 to 18 months out. Sites quoting a 2030 price for MOS are extrapolating price history, which says nothing about the business. The furthest attributed numbers are the current analyst targets: $17 to $35 over the next 12 months.

How has MOS stock performed over the past year?

The Mosaic Co. returned -19.3% over the 12 months to 3 Sept 2026, with dividends reinvested. Past performance does not indicate future returns.

What does The Mosaic Co. do?

The Mosaic Company is a global agricultural inputs company that produces and markets concentrated phosphate and potash crop nutrients. Its operations center on mining, processing, and distributing fertilizer products used to support crop nutrition, along with phosphate-based animal feed ingredients and related industrial products.

What is the latest news on MOS?

The most recent item we track (Zacks Investment Research, 3 Sept 2026): "Why Is Mosaic (MOS) Up 10.1% Since Last Earnings Report?". Mosaic (MOS) last reported earnings 30 days ago, and its stock has risen 10.1% since that report. The item examines what may be next for the company following this earnings-driven price movement.

Company

About The Mosaic Co.

The Mosaic Company is a global agricultural inputs company that produces and markets concentrated phosphate and potash crop nutrients. Its operations center on mining, processing, and distributing fertilizer products used to support crop nutrition, along with phosphate-based animal feed ingredients and related industrial products. The company serves farmers, distributors, and agribusiness customers across North America and international markets through its Phosphates, Potash, and Mosaic Fertilizantes segments. Mosaic’s business combines resource extraction with large-scale chemical processing and fertilizer blending, making it an important supplier within the agricultural supply chain. Headquartered in Tampa, Florida, The Mosaic Company focuses on delivering essential nutrients that help improve soil fertility and support food production worldwide.

CEO Mr. Bruce M. Bodine Jr. · 13,000 employees · United States · https://www.mosaicco.com