CFCFBasic Materials · Agricultural Inputs

CF Stock Forecast: CF Industries Holdings, Inc. Price Predictions for 2026-2027

Last close, 14 Aug 2026
$118
+1.07% on the day

The 21 Wall Street analysts covering CF Industries Holdings, Inc. hold a median 12-month price target of $123 — +4.0% from the last close. Ticker Nerd's systematic factor model, run across ~4,600 US stocks, ranks it 85 of 100 as at 13 Aug 2026 — inside the top quartile. Here, the model and the Street point the same way.

Market cap
$17.9B
Ticker Nerd rank
85 / 100
Median analyst target
$123
Analysts covering
21
Total return, dividends reinvested
1W
+3.5%
1M
−0.7%
YTD
+54.4%
1Y
+41.7%
From 52W high
−13.7%
From 52W low
+56.9%
$75
$137
52-week range, adjusted closes · the dot is the last close
Ticker Nerd rank

CF stock analysis: one number for the whole business

Consensus tells you what everyone already believes. The model scores CF Industries Holdings, Inc. on its factor families — the same systematic rank behind the Ticker Nerd portfolio.

Where the model ranks itAs at 13 Aug 2026
85 / 100

Percentile across ~4,600 US stocks on Ticker Nerd’s systematic factor model. Higher is better. How the model is built and tested

Quality
98
Value
97
Growth
96
Volatility
89
Issuance
72
Momentum
70
Accruals
45
Revisions
37
Size
11

Quality (98): The business earns solid, repeatable profits on what it owns.

Revisions (37): Analysts have, on balance, been cutting their forecasts.

Size (11): Larger than most of the companies we track — more scrutinised, less often mispriced.

Built and run by Aslam Ghouse, an ex-Goldman Sachs quant trader with fourteen years in markets.

The Ticker Nerd Read

A high factor rank against a Street that mostly holds.

As of 8 August 2026, Ticker Nerd's factor model ranks CF Industries 88 of 100 across roughly 4,600 US stocks. Four families carry the score: Value (97), Quality (97), Growth (96) and Low Volatility (91). The shares cost little relative to what the company earns, profits are solid and repeatable, and sales and operating income are climbing.

The drags sit in Estimate Revisions (43) and Investment/Accruals (46). Analysts on balance have been cutting forecasts — next-year consensus EPS fell to $10.34 from $10.78 over the ninety days to 4 August 2026 — and the accruals family flags a gap between reported profit and cash. The market-cap factor (11) is weak because CF is large, the opposite of the small-cap size tilt the model rewards.

Alongside that strong rank, the Street keeps its distance. The median analyst target of $121 as of 8 August 2026 sits a few dollars above the last close of $114.35 on 7 August, and 13 of the 21 analysts covering the stock rate it Hold rather than Buy.

Q2 2026 earnings missed estimates on lower volumes and the Yazoo City outage even as quarterly sales rose 17.6%, a news thread still running as of 7 August. The model's Value, Quality and Growth readings rest on tight global nitrogen conditions that management expects to persist through 2027. A turn in nitrogen fundamentals, or the estimate cuts reversing, would move how both our model and the Street read the shares.

As of 10 Aug 2026
Wall Street

CF stock forecast 2026-2027: analyst price targets & predictions

The bullish and bearish analyst opinions on CF, reported as data — targets and ratings, the market's view beside the model's.

Share price and the analyst range, 12 monthsAdjusted close, US dollars
$100$150$200Oct 25Jan 26Apr 26Jul 26CFHigh $196Median $123Low $100

Price targets and ratings are third-party analyst estimates, reported here as data. They are not Ticker Nerd forecasts, and they are frequently wrong.

What Wall Street says21 analysts
6 Buy12 Hold3 Sell
Low $100Median $123High $196

The green dot is the last close — the median target sits +4.0% from it.

Recent analyst actionsNewest first

Of the 20 most recent actions, 2 moved their price target up and 1 moved it down.

DateFirmActionRatingTarget
10 Aug 2026ScotiabankMaintainsSector Outperform$125$130
7 Aug 2026UBSMaintainsNeutral$115$123
17 July 2026RBC CapitalMaintainsSector Perform$125$115
17 July 2026RBC CapitalMaintainsSector Perform
7 July 2026Morgan StanleyMaintainsEqual-Weight
30 June 2026ScotiabankUpgradeSector Outperform
3 June 2026JP MorganMaintainsNeutral
11 May 2026ScotiabankMaintainsSector Perform
30 Apr 2026CIBCMaintainsNeutral
27 Apr 2026BarclaysMaintainsOverweight
20 Apr 2026ScotiabankMaintainsSector Perform
17 Apr 2026BarclaysMaintainsOverweight
14 Apr 2026Goldman SachsMaintainsNeutral
8 Apr 2026Morgan StanleyMaintainsEqual-Weight
31 Mar 2026MizuhoMaintainsUnderperform
26 Mar 2026UBSMaintainsNeutral
18 Mar 2026B of A SecuritiesMaintainsUnderperform
18 Mar 2026BMO CapitalMaintainsOutperform
18 Mar 2026MizuhoDowngradeUnderperform
17 Mar 2026CIBCMaintainsNeutral

Price targets and ratings are third-party analyst estimates, reported here as data. They are not Ticker Nerd forecasts, and they are frequently wrong.

Market Radar

This page is one stock. Monday covers all of them.

Computed off the Friday close and sent before the US open.

Market Radar reports the week’s largest rank changes across roughly 4,600 US stocks, the factor behind each one, and where the market went. CF appears on the weeks it earns a place.

Free, every Monday. Unsubscribe any time.

Estimates

CF analyst estimate revisions

Not the forecast itself — the direction analysts are revising it. Revision direction is one of the model's factor families.

Which way the estimates are movingNext fiscal year
EPS revision, 90 days
−22.3%
Analysts raising
0
Analysts cutting
2
Fundamentals

CF Industries Holdings, Inc. (CF) financial data

A margin means little on its own. Each bar marks where the figure sits across the whole US universe we score.

Valuation
Trailing P/E
8.8×

Cheaper than 61% of US stocks

Price / sales
2.3×

Cheaper than 49% of US stocks

Price / book
3.1×

Cheaper than 34% of US stocks

EV / EBITDA
5.7×

Cheaper than 52% of US stocks

Growth & margins
Revenue growth (YoY)
17.6%

Higher than 67% of US stocks

Earnings growth (YoY)
88.3%

Higher than 83% of US stocks

Gross margin
51.5%

Higher than 64% of US stocks

Operating margin
49.3%

Higher than 96% of US stocks

Net margin
27.1%

Higher than 87% of US stocks

Returns & dividend
Return on equity
29.9%

Higher than 88% of US stocks

Return on assets
12.9%

Higher than 96% of US stocks

Dividend yield
2.0%

Higher than 46% of US dividend payers

Bars mark the percentile across the ~4,600 US stocks Ticker Nerd covers, among those reporting the figure.

Peers

CF vs competitors

The nearest names by industry and size, scored by the same model — like for like.

Its peer group, ranked by the same modelAgricultural Inputs
CompanyMarket capTKN rank
CFCF Industries Holdings, Inc.$17.9B
85
NTRNutrien Ltd.$32.2B
87
ICLICL Group Ltd.$7.0B
65
MOSThe Mosaic Co.$6.9B
17
CTVACorteva, Inc.$50.7B
61
SMGScotts Miracle-Gro Co.$3.6B
76
FMCFMC Corp.$1.3B
26

Look up any of the roughly 4,600 stocks we score.

The rank is the raw material. Whether the rules would actually own CF Industries Holdings, Inc. — and when they’d sell — is the membership. See the Ticker Nerd 20 →

News

Latest CF news & analysis

CF Industries Q2 Earnings Call Highlights

MarketBeat · 8 Aug 2026positive

CF Industries reported first-half 2026 adjusted EBITDA of $2.2 billion and second-quarter adjusted EBITDA of $1.2 billion, supported by tight global nitrogen supply-demand conditions and strong operating performance.

Why it matters — A CF watcher would monitor these earnings results as an indicator of how global nitrogen market conditions and operating performance are driving the company's financials.

CF Q2 Earnings Call Highlights Higher Mid-Cycle Earnings Power

Zacks Investment Research · 7 Aug 2026positive

CF Industries' Q2 earnings call highlighted higher mid-cycle earnings power, driven by rising construction costs that boost nitrogen economics, with tight fundamentals expected through 2027.

Why it matters — A CF watcher would care because the outlook for sustained tight nitrogen fundamentals and higher earnings power could signal a longer period of favorable conditions for the company.

CF Industries Holdings, Inc. (CF) Q2 2026 Earnings Call Transcript

Seeking Alpha · 6 Aug 2026neutral

Seeking Alpha published the transcript of CF Industries Holdings, Inc.'s Q2 2026 earnings call. The item provides the full transcript of the company's earnings call discussion.

Why it matters — A CF watcher would care because the transcript offers direct insight into management's discussion of the company's second-quarter 2026 results and outlook.

CF Q2 Earnings Miss Estimates Despite Strong Nitrogen Pricing

Zacks Investment Research · 6 Aug 2026negative

CF Industries' second-quarter earnings missed estimates, as lower volumes and the Yazoo City outage offset stronger nitrogen pricing. Sales nonetheless rose 17.6% in the quarter.

Why it matters — A CF watcher would care because the earnings miss signals that operational and volume headwinds outweighed the benefit of strong nitrogen pricing in the quarter.

CF (CF) Reports Q2 Earnings: What Key Metrics Have to Say

Zacks Investment Research · 6 Aug 2026neutral

Zacks Investment Research reported on CF Industries' Q2 earnings for the quarter ended June 2026, noting that revenue and EPS figures are now being compared against Wall Street estimates and year-ago numbers to gauge how the business performed.

Why it matters — The analysis gives CF watchers insight into whether the company's key financial metrics met Wall Street expectations for the quarter.

FAQ

Frequently asked questions about CF stock

What is the CF stock price forecast for 2026-2027?

The 21 Wall Street analysts covering CF Industries Holdings, Inc. have a median 12-month price target of $123, with estimates ranging from $100 to $196. These are third-party analyst estimates, not Ticker Nerd forecasts, and they are frequently wrong.

Is CF stock a buy right now?

Of the 21 analysts covering CF Industries Holdings, Inc., 6 rate it a Buy, 12 a Hold and 3 a Sell. Ticker Nerd's systematic factor model ranks CF Industries Holdings, Inc. 85 out of 100 across roughly 4,600 US stocks as at 13 Aug 2026. None of this is personal advice — it does not consider your circumstances.

How does Ticker Nerd's model rank CF?

As at 13 Aug 2026, CF Industries Holdings, Inc. ranks 85 out of 100 on Ticker Nerd's systematic factor model — a percentile across roughly 4,600 US stocks, built from its factor families. Its strongest factor family is Quality (98 of 100).

Will CF stock go up?

No one can know that. What the data says: the median 12-month target from 21 analysts implies +4.0% from the last close, and Ticker Nerd's factor model ranks CF Industries Holdings, Inc. 85 out of 100 as at 13 Aug 2026. Analyst targets are third-party estimates and frequently wrong; none of this is personal advice.

What is the CF stock forecast for 2030?

No analyst covering CF Industries Holdings, Inc. publishes a 2030 price target — Wall Street targets run 12 to 18 months out. Sites quoting a 2030 price for CF are extrapolating price history, which says nothing about the business. The furthest attributed numbers are the current analyst targets: $100 to $196 over the next 12 months.

How has CF stock performed over the past year?

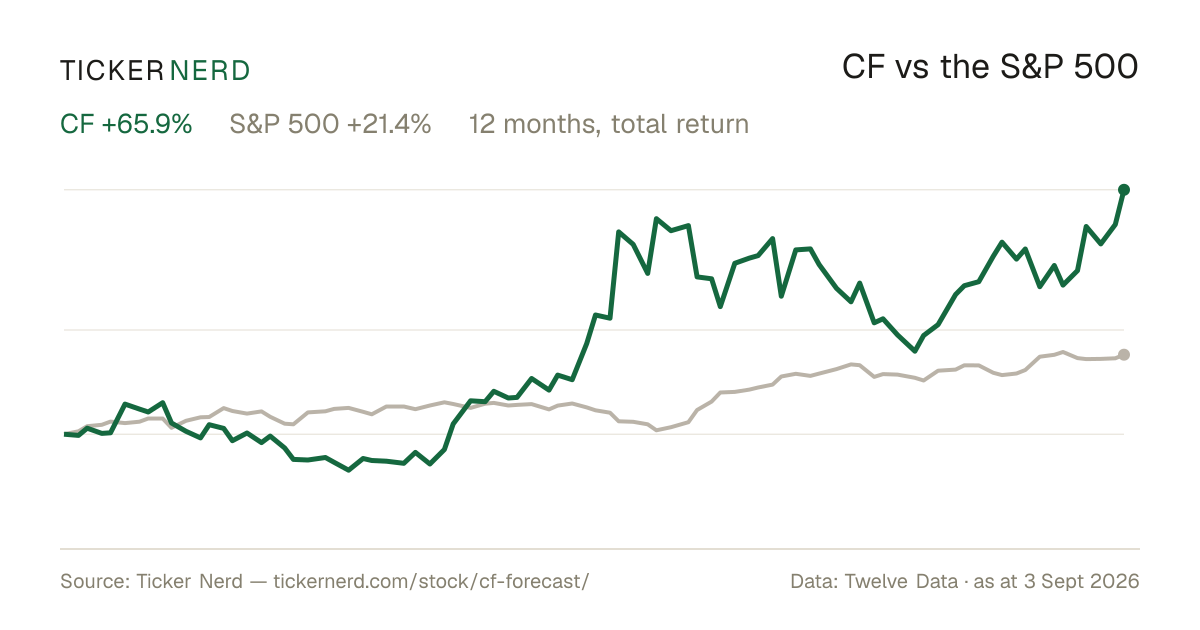
CF Industries Holdings, Inc. returned +41.7% over the 12 months to 14 Aug 2026, with dividends reinvested. Past performance does not indicate future returns.

What does CF Industries Holdings, Inc. do?

CF Industries Holdings makes ammonia and the nitrogen fertilizers built from it — anhydrous ammonia, granular urea, urea ammonium nitrate and ammonium nitrate — plus industrial products such as diesel exhaust fluid and nitric acid used in emissions control. It runs large manufacturing complexes in the United States, Canada and the United Kingdom, selling through its own storage and distribution network to cooperatives, fertilizer distributors, wholesalers and farmers in North America, Europe and elsewhere.

What is the latest news on CF?

The most recent item we track (MarketBeat, 8 Aug 2026): "CF Industries Q2 Earnings Call Highlights". CF Industries reported first-half 2026 adjusted EBITDA of $2.2 billion and second-quarter adjusted EBITDA of $1.2 billion, supported by tight global nitrogen supply-demand conditions and strong operating performance.

How does CF's factor rank compare with the peers listed on its page?

As of 8 August 2026, CF ranks 88 of 100, marginally above Nutrien (88) and ahead of ICL (60), Corteva (61), Scotts Miracle-Gro (76), Mosaic (18) and FMC (26) in our model. Nutrien is the closest comparator by market value at about $31 billion.

Why does the Estimate Revisions factor lag when current-year forecasts rose?

The current-year consensus EPS rose 14.3% over the ninety days to 4 August 2026, but the next-year consensus fell 4.1%, and the latest week trimmed the current-year figure from $17.55 to $16.81. The Estimate Revisions factor at 43 captures that recent cutting.

Company

About CF Industries Holdings, Inc.

CF Industries Holdings makes ammonia and the nitrogen fertilizers built from it — anhydrous ammonia, granular urea, urea ammonium nitrate and ammonium nitrate — plus industrial products such as diesel exhaust fluid and nitric acid used in emissions control. It runs large manufacturing complexes in the United States, Canada and the United Kingdom, selling through its own storage and distribution network to cooperatives, fertilizer distributors, wholesalers and farmers in North America, Europe and elsewhere. The company is headquartered in Northbrook, Illinois, has about 2,900 employees and was founded in 1946.

CEO Mr. Christopher D. Bohn · 2,900 employees · United States · https://www.cfindustries.com