NEXANEXABasic Materials · Other Industrial Metals & Mining

NEXA Stock Forecast: Nexa Resources SA Price Predictions for 2026-2027

Last close, 14 Aug 2026
$14
−1.05% on the day

The 8 Wall Street analysts covering Nexa Resources SA hold a median 12-month price target of $15 — +5.8% from the last close. Ticker Nerd's systematic factor model, run across ~4,600 US stocks, ranks it 96 of 100 as at 15 Aug 2026 — among the strongest tenth. Here, the model and the Street point the same way.

Market cap
$1.9B
Ticker Nerd rank
96 / 100
Median analyst target
$15
Analysts covering
8
Total return, dividends reinvested
1W
+0.6%
1M
−1.3%
YTD
+61.9%
1Y
+193.6%
From 52W high
−14.3%
From 52W low
+200.9%
$5
$17
52-week range, adjusted closes · the dot is the last close
Ticker Nerd rank

NEXA stock analysis: one number for the whole business

Consensus tells you what everyone already believes. The model scores Nexa Resources SA on its factor families — the same systematic rank behind the Ticker Nerd portfolio.

Where the model ranks itAs at 15 Aug 2026
96 / 100

Percentile across ~4,600 US stocks on Ticker Nerd’s systematic factor model. Higher is better. How the model is built and tested

Value
99
Growth
99
Momentum
96
Quality
91
Issuance
85
Volatility
53
Accruals
46
Revisions
44
Size
37

Value (99): The shares cost little relative to the profits and assets behind them — which can mean the market is too gloomy, or that the business really is in trouble.

Revisions (44): Analysts have, on balance, been cutting their forecasts.

Size (37): Larger than most of the companies we track — more scrutinised, less often mispriced.

Built and run by Aslam Ghouse, an ex-Goldman Sachs quant trader with fourteen years in markets.

Wall Street

NEXA stock forecast 2026-2027: analyst price targets & predictions

The bullish and bearish analyst opinions on NEXA, reported as data — targets and ratings, the market's view beside the model's.

Share price and the analyst range, 12 monthsAdjusted close, US dollars
$4$6$8$10$12$14$16Oct 25Jan 26Apr 26Jul 26NEXAHigh $16Median $15Low $13

Price targets and ratings are third-party analyst estimates, reported here as data. They are not Ticker Nerd forecasts, and they are frequently wrong.

What Wall Street says8 analysts
0 Buy7 Hold1 Sell
Low $13Median $15High $16

The green dot is the last close — the median target sits +5.8% from it.

Recent analyst actionsNewest first

Of the 20 most recent actions, 4 moved their price target up and 1 moved it down.

DateFirmActionRatingTarget
8 Aug 2026ScotiabankMaintainsSector Perform
7 Aug 2026ScotiabankMaintainsSector Perform$15$14
24 July 2026JP MorganMaintainsNeutral$7.50$16
24 July 2026JP MorganMaintainsNeutral
9 July 2026B of A SecuritiesMaintainsUnderperform$12$14
9 July 2026B of A SecuritiesMaintainsUnderperform
8 July 2026Morgan StanleyMaintainsEqual-Weight$12$13
8 July 2026Morgan StanleyMaintainsEqual-Weight
7 July 2026ScotiabankMaintainsSector Perform$15$15
7 July 2026ScotiabankMaintainsSector Perform
15 June 2026ScotiabankMaintainsSector Perform
3 June 2026CitigroupMaintainsNeutral
14 Apr 2026CitigroupMaintainsNeutral
26 Mar 2026CitigroupMaintainsNeutral
23 Mar 2026ScotiabankMaintainsSector Perform
26 Feb 2026JP MorganMaintainsNeutral
3 Feb 2026CitigroupMaintainsNeutral
3 Nov 2025ScotiabankMaintainsSector Perform
28 Oct 2025ScotiabankMaintainsSector Perform
17 Oct 2025JP MorganMaintainsNeutral

Price targets and ratings are third-party analyst estimates, reported here as data. They are not Ticker Nerd forecasts, and they are frequently wrong.

Market Radar

This page is one stock. Monday covers all of them.

Computed off the Friday close and sent before the US open.

Market Radar reports the week’s largest rank changes across roughly 4,600 US stocks, the factor behind each one, and where the market went. NEXA appears on the weeks it earns a place.

Free, every Monday. Unsubscribe any time.

Estimates

NEXA analyst estimate revisions

Not the forecast itself — the direction analysts are revising it. Revision direction is one of the model's factor families.

Which way the estimates are movingNext fiscal year
EPS revision, 90 days
+18.8%
Analysts raising
2
Analysts cutting
1
Fundamentals

Nexa Resources SA (NEXA) financial data

A margin means little on its own. Each bar marks where the figure sits across the whole US universe we score.

Valuation
Trailing P/E
6.9×

Cheaper than 64% of US stocks

Price / sales
0.5×

Cheaper than 82% of US stocks

Price / book
1.6×

Cheaper than 55% of US stocks

EV / EBITDA
3.9×

Cheaper than 55% of US stocks

Growth & margins
Revenue growth (YoY)
28.2%

Higher than 77% of US stocks

Earnings growth (YoY)
6234.7%

Higher than 99% of US stocks

Gross margin
28.3%

Higher than 32% of US stocks

Operating margin
19.8%

Higher than 79% of US stocks

Net margin
8.0%

Higher than 66% of US stocks

Returns & dividend
Return on equity
29.9%

Higher than 88% of US stocks

Return on assets
8.4%

Higher than 89% of US stocks

Dividend yield
1.2%

Higher than 28% of US dividend payers

Bars mark the percentile across the ~4,600 US stocks Ticker Nerd covers, among those reporting the figure.

Peers

NEXA vs competitors

The nearest names by industry and size, scored by the same model — like for like.

Its peer group, ranked by the same modelOther Industrial Metals & Mining
CompanyMarket capTKN rank
NEXANexa Resources SA$1.9B
96
EMATEvolution Metals & Technologies Corp.$1.8B
8
TMCTMC the metals co., Inc.$1.8B
5
SSMRSunshine Silver Mining & Refining Co.$2.3B
0
SGMLSigma Lithium Corp.$1.3B
46
LACLithium Americas Corp.$1.2B
10
CMPCompass Minerals International, Inc.$1.1B
99

Look up any of the roughly 4,600 stocks we score.

The rank is the raw material. Whether the rules would actually own Nexa Resources SA — and when they’d sell — is the membership. See the Ticker Nerd 20 →

News

Latest NEXA news & analysis

Strategic Metals: 3 Top Stocks Riding Strong Structural Demand

Seeking Alpha · 10 Aug 2026positive

The article notes that strategic metals including copper, zinc, and aluminum have outperformed equities over the past year, supported by structural demand from AI infrastructure, the energy transition, and defense buildup. It suggests these tailwinds could support long-term volume and pricing across the metals value chain.

Why it matters — As a zinc-focused producer, Nexa Resources could be relevant to investors following structural demand trends in base metals.

Nexa Resources Q2 Earnings Call Highlights

MarketBeat · 8 Aug 2026positive

Nexa Resources reported second-quarter 2026 adjusted EBITDA of $286 million, up 78% year over year, with net income of $98 million ($0.52 per share) and net revenue of $908 million, up 28%. The results were driven by higher metal prices, a recovery in Peruvian mining operations, and improved Brazilian smelter performance.

Why it matters — The strong quarterly results reflect meaningful improvement across Nexa's mining and smelting operations that a company watcher would monitor for earnings momentum.

NEXA Q2 Earnings Call Emphasizes 2H Ramp and Debt Reduction

Zacks Investment Research · 7 Aug 2026positive

Nexa Resources held its Q2 earnings call, reaffirming its 2026 guidance and pointing to a stronger second-half production ramp driven by its Aripuana mine, recovery in Peru, and normalization at the Cajamarquilla refinery.

Why it matters — NEXA watchers would care because the company's confidence in its second-half ramp and debt-reduction trajectory signals operational momentum and financial discipline in the near term.

Nexa Resources S.A. (NEXA) Q2 2026 Earnings Call Transcript

Seeking Alpha · 7 Aug 2026neutral

Seeking Alpha published the transcript of Nexa Resources S.A.'s Q2 2026 earnings call. The transcript covers the company's second-quarter 2026 results and management commentary from the call.

Why it matters — A NEXA watcher would turn to this transcript for details on the company's second-quarter 2026 performance and management's outlook.

Nexa Resources S.A. (NEXA) Q2 Earnings and Revenues Lag Estimates

Zacks Investment Research · 5 Aug 2026negative

Nexa Resources S.A. reported Q2 earnings of $0.64 per share, missing the Zacks Consensus Estimate of $0.73 per share. According to the report, the company's quarterly earnings and revenues lagged estimates.

Why it matters — A NEXA watcher would care because the quarterly results came in below analyst expectations on both earnings and revenues.

FAQ

Frequently asked questions about NEXA stock

What is the NEXA stock price forecast for 2026-2027?

The 8 Wall Street analysts covering Nexa Resources SA have a median 12-month price target of $15, with estimates ranging from $13 to $16. These are third-party analyst estimates, not Ticker Nerd forecasts, and they are frequently wrong.

Is NEXA stock a buy right now?

Of the 8 analysts covering Nexa Resources SA, 0 rate it a Buy, 7 a Hold and 1 a Sell. Ticker Nerd's systematic factor model ranks Nexa Resources SA 96 out of 100 across roughly 4,600 US stocks as at 15 Aug 2026. None of this is personal advice — it does not consider your circumstances.

How does Ticker Nerd's model rank NEXA?

As at 15 Aug 2026, Nexa Resources SA ranks 96 out of 100 on Ticker Nerd's systematic factor model — a percentile across roughly 4,600 US stocks, built from its factor families. Its strongest factor family is Value (99 of 100).

Will NEXA stock go up?

No one can know that. What the data says: the median 12-month target from 8 analysts implies +5.8% from the last close, and Ticker Nerd's factor model ranks Nexa Resources SA 96 out of 100 as at 15 Aug 2026. Analyst targets are third-party estimates and frequently wrong; none of this is personal advice.

What is the NEXA stock forecast for 2030?

No analyst covering Nexa Resources SA publishes a 2030 price target — Wall Street targets run 12 to 18 months out. Sites quoting a 2030 price for NEXA are extrapolating price history, which says nothing about the business. The furthest attributed numbers are the current analyst targets: $13 to $16 over the next 12 months.

How has NEXA stock performed over the past year?

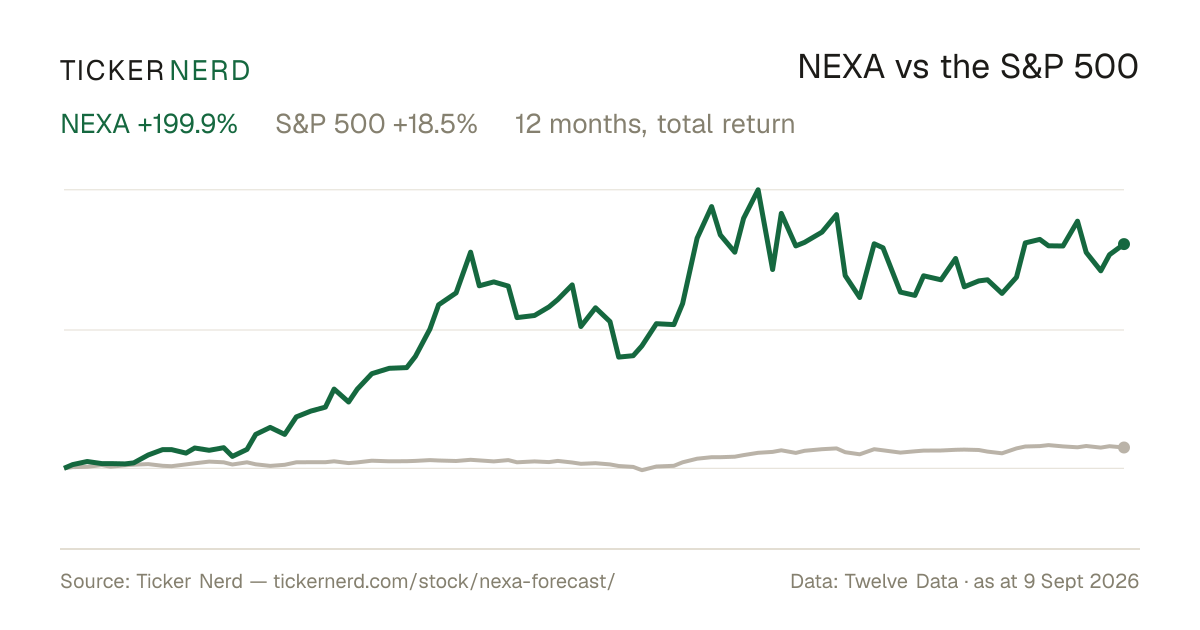
Nexa Resources SA returned +193.6% over the 12 months to 14 Aug 2026, with dividends reinvested. Past performance does not indicate future returns.

What does Nexa Resources SA do?

Nexa Resources S.A. is a metals and mining company focused on the extraction and processing of non-ferrous metals, with a primary emphasis on zinc.

What is the latest news on NEXA?

The most recent item we track (Seeking Alpha, 10 Aug 2026): "Strategic Metals: 3 Top Stocks Riding Strong Structural Demand". The article notes that strategic metals including copper, zinc, and aluminum have outperformed equities over the past year, supported by structural demand from AI infrastructure, the energy transition, and defense buildup. It suggests these tailwinds could support long-term volume and pricing across the metals value chain.

Company

About Nexa Resources SA.

Nexa Resources S.A. is a metals and mining company focused on the extraction and processing of non-ferrous metals, with a primary emphasis on zinc. The company operates through two main business segments: Mining, which covers mineral exploration and the production of polymetallic concentrates, and Smelting, which refines zinc and related products from concentrates and secondary feed materials. Nexa Resources S.A. produces zinc, zinc alloys and zinc oxide, along with significant by-products including copper, lead, silver, gold and sulfuric acid, supplying a broad range of industrial applications in construction, transportation, energy, agriculture, healthcare and consumer goods. It runs large-scale underground and open-pit mines and integrated smelting facilities in Brazil and Peru, and exports to multiple regions including the Americas, Europe and Asia. Headquartered in Luxembourg with operational hubs in Brazil and Peru, Nexa Resources S.A. is recognized as one of the leading zinc producers in the Americas and an important participant in the global basic materials sector.

CEO Mr. Juan Ignacio Rosado Gomez de La Torre · Luxembourg · https://www.nexaresources.com