NOMANOMAConsumer Cyclical · Leisure

NOMA Stock Forecast: Nomadar Corp. Price Predictions for 2026-2027

Last close, 3 Aug 2026
$2.97
−1.33% on the day

Ticker Nerd's systematic factor model, run across ~4,600 US stocks, ranks it 4 of 100 as at 1 Aug 2026 — in the weakest quartile.

Market cap
$52.3M
Ticker Nerd rank
4 / 100
Median analyst target
Analysts covering
Total return, dividends reinvested
1W
−12.6%
1M
−28.4%
YTD
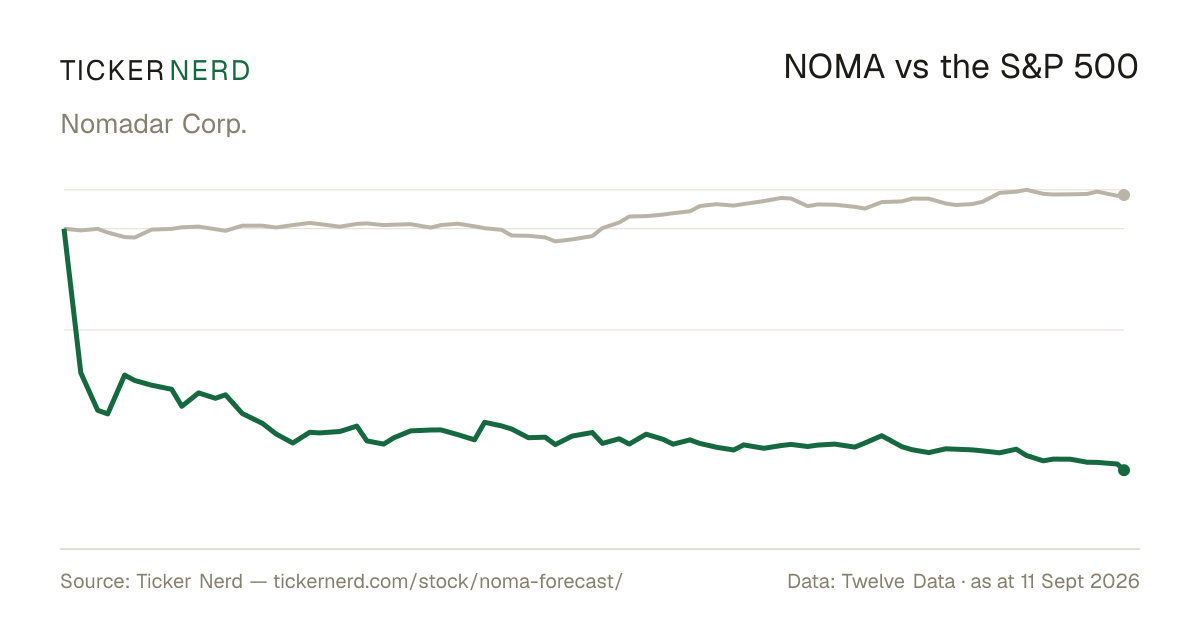
−33.7%
From high
−85.9%
From low
+3.5%
$3
$21
Range since 31 Oct 2025, adjusted closes · the dot is the last close
Ticker Nerd rank

NOMA stock analysis: one number for the whole business

Consensus tells you what everyone already believes. The model scores Nomadar Corp. on its factor families — the same systematic rank behind the Ticker Nerd portfolio.

Where the model ranks itAs at 1 Aug 2026
4 / 100

Percentile across ~4,600 US stocks on Ticker Nerd’s systematic factor model. Higher is better. How the model is built and tested

Size
81
Accruals
40
Revisions
25
Growth
20
Issuance
8
Value
7
Momentum
7
Quality
6
Volatility
2

Size (81): Smaller than most of the companies we track.

Volatility (2): The share price moves around a lot.

The rank is the raw material. Whether the rules would actually own Nomadar Corp. — and when they’d sell — is the membership.

Wall Street

NOMA stock forecast 2026-2027: analyst price targets & predictions

The bullish and bearish analyst opinions on NOMA, reported as data — targets and ratings, the market's view beside the model's.

Share price and the analyst range, since 31 Oct 2025Adjusted close, US dollars
$0$5$10$15$20Jan 26Apr 26Jul 26NOMA

Price targets and ratings are third-party analyst estimates, reported here as data. They are not Ticker Nerd forecasts, and they are frequently wrong.

Price targets and ratings are third-party analyst estimates, reported here as data. They are not Ticker Nerd forecasts, and they are frequently wrong.

Estimates

NOMA analyst estimate revisions

Not the forecast itself — the direction analysts are revising it. Revision direction is one of the model's factor families.

Fundamentals

Nomadar Corp. (NOMA) financial data

A margin means little on its own. Each bar marks where the figure sits across the whole US universe we score.

Valuation
Trailing P/E
−17.6×

Cheaper than 95% of US stocks

Price / sales
45.9×

Cheaper than 6% of US stocks

Price / book
4.3×

Cheaper than 24% of US stocks

EV / EBITDA
−19.9×

Cheaper than 89% of US stocks

Growth & margins
Revenue growth (YoY)
116.0%

Higher than 94% of US stocks

Earnings growth (YoY)
116.0%

Higher than 88% of US stocks

Gross margin
88.1%

Higher than 96% of US stocks

Operating margin
−186.9%

Higher than 11% of US stocks

Net margin
51.7%

Higher than 96% of US stocks

Returns & dividend
Return on equity
−80.8%

Higher than 16% of US stocks

Return on assets
−20.9%

Higher than 19% of US stocks

Dividend yield

Bars mark the percentile across the ~4,600 US stocks Ticker Nerd covers, among those reporting the figure.

Peers

NOMA vs competitors

The nearest names by industry and size, scored by the same model — like for like.

Its peer group, ranked by the same modelLeisure
CompanyMarket capTKN rank
NOMANomadar Corp.$52.3M
4
PUSAAureus Greenway Holdings, Inc.$65.2M
13
KBSXFST Corp.$37.8M
67
GDHGGolden Heaven Group Holdings Ltd.$67.4M
14
KMRKK-Tech Solutions Co., Ltd.$22.6M
1
CLARClarus Corp.$123.3M
88
PLBYPlayboy, Inc.$127.5M
39
Market Radar

This page is one stock. Monday covers all of them.

Computed off the Friday close and sent before the US open.

Market Radar reports the week’s largest rank changes across roughly 4,600 US stocks, the factor behind each one, and where the market went. NOMA appears on the weeks it earns a place.

Free, every Monday. Unsubscribe any time.

FAQ

Frequently asked questions about NOMA stock

How does Ticker Nerd's model rank NOMA?

As at 1 Aug 2026, Nomadar Corp. ranks 4 out of 100 on Ticker Nerd's systematic factor model — a percentile across roughly 4,600 US stocks, built from its factor families. Its strongest factor family is Size (81 of 100).

What is the NOMA stock forecast for 2030?

No analyst covering Nomadar Corp. publishes a 2030 price target — Wall Street targets run 12 to 18 months out. Sites quoting a 2030 price for NOMA are extrapolating price history, which says nothing about the business.

What does Nomadar Corp. do?

Nomadar Corp. is a sport technology company that operates at the forefront of the sports, tourism, technology, and health sectors.

Company

About Nomadar Corp.

Nomadar Corp. is a sport technology company that operates at the forefront of the sports, tourism, technology, and health sectors. With its roots as a subsidiary of Cádiz CF—a 115-year-old professional soccer club in Spain's La Liga—Nomadar Corp. is dedicated to building a global ecosystem that interconnects athletic performance, fan engagement, wellness, and travel. Central to its business is the development and operation of innovative sport technology platforms tailored for professional teams, athletes, coaches, recreational enthusiasts, and general customers. The company’s diverse portfolio also encompasses educational high-performance training programs for elite soccer talent, consulting services for sports organizations, as well as the planned real estate development of Sportech City—a large-scale, multi-purpose complex in Southern Spain intended to host international sporting events, cultural performances, conferences, and corporate gatherings. Nomadar’s cross-sector approach positions it as a unique player in the market, leveraging strategic partnerships, technological innovation, and brand affiliations to bridge the gap between sports, entertainment, and wellness in a rapidly evolving industry landscape.

CEO Mr. Rafael Jesus Contreras Chamorro Ph.D. · 8 employees · United States · https://nomadar.com