OLMAOLMAHealthcare · Biotechnology

OLMA Stock Forecast: Olema Pharmaceuticals, Inc. Price Predictions for 2026-2027

Last close, 3 Aug 2026
$11
−1.48% on the day

The 12 Wall Street analysts covering Olema Pharmaceuticals, Inc. hold a median 12-month price target of $40 — +254.6% from the last close. Ticker Nerd's systematic factor model, run across ~4,600 US stocks, ranks it 40 of 100 as at 1 Aug 2026 — in the lower half.

Market cap
$1.0B
Ticker Nerd rank
40 / 100
Median analyst target
$40
Analysts covering
12
Total return, dividends reinvested
1W
−6.1%
1M
−10.8%
YTD
−54.9%
1Y
+111.6%
From 52W high
−68.5%
From 52W low
+146.8%
$5
$36
52-week range, adjusted closes · the dot is the last close
Ticker Nerd rank

OLMA stock analysis: one number for the whole business

Consensus tells you what everyone already believes. The model scores Olema Pharmaceuticals, Inc. on its factor families — the same systematic rank behind the Ticker Nerd portfolio.

Where the model ranks itAs at 1 Aug 2026
40 / 100

Percentile across ~4,600 US stocks on Ticker Nerd’s systematic factor model. Higher is better. How the model is built and tested

Quality
70
Value
67
Momentum
65
Revisions
53
Size
45
Volatility
45
Accruals
38
Growth
25
Issuance
24

Quality (70): The business earns solid, repeatable profits on what it owns.

Issuance (24): The company has been issuing shares or taking on financing, diluting existing holders.

The rank is the raw material. Whether the rules would actually own Olema Pharmaceuticals, Inc. — and when they’d sell — is the membership.

Wall Street

OLMA stock forecast 2026-2027: analyst price targets & predictions

The bullish and bearish analyst opinions on OLMA, reported as data — targets and ratings, the market's view beside the model's.

Share price and the analyst range, 12 monthsAdjusted close, US dollars
$0$10$20$30$40$50$60$70Oct 25Jan 26Apr 26Jul 26OLMAHigh $62Median $40Low $23

Price targets and ratings are third-party analyst estimates, reported here as data. They are not Ticker Nerd forecasts, and they are frequently wrong.

What Wall Street says12 analysts
11 Buy1 Hold0 Sell
Low $23Median $40High $62

The green dot is the last close — the median target sits +254.6% from it.

Recent analyst actionsNewest first
DateFirmActionRatingTarget
13 May 2026GuggenheimMaintainsBuy$38$35
27 Mar 2026Wolfe ResearchInitiatesPeer Perform
19 Mar 2026JefferiesAssumesBuy$43$40
18 Mar 2026Goldman SachsMaintainsBuy
18 Mar 2026JP MorganMaintainsOverweight
17 Mar 2026CitigroupMaintainsBuy
17 Mar 2026GuggenheimMaintainsBuy
9 Mar 2026HC Wainwright & Co.MaintainsBuy
11 Feb 2026StifelInitiatesBuy
7 Jan 2026Piper SandlerInitiatesOverweight
7 Jan 2026UBSInitiatesBuy
12 Dec 2025CitigroupMaintainsBuy
11 Dec 2025Goldman SachsMaintainsBuy
11 Dec 2025HC Wainwright & Co.MaintainsBuy
11 Dec 2025OppenheimerMaintainsOutperform
21 Nov 2025Goldman SachsMaintainsBuy
18 Nov 2025HC Wainwright & Co.MaintainsBuy
18 Nov 2025JP MorganMaintainsOverweight
18 Nov 2025OppenheimerMaintainsOutperform
20 Oct 2025HC Wainwright & Co.ReiteratesBuy

Price targets and ratings are third-party analyst estimates, reported here as data. They are not Ticker Nerd forecasts, and they are frequently wrong.

Estimates

OLMA analyst estimate revisions

Not the forecast itself — the direction analysts are revising it. Revision direction is one of the model's factor families.

Which way the estimates are movingNext fiscal year
Analysts raising
4
Analysts cutting
5
Fundamentals

Olema Pharmaceuticals, Inc. (OLMA) financial data

A margin means little on its own. Each bar marks where the figure sits across the whole US universe we score.

Valuation
Trailing P/E
−6.1×

Cheaper than 90% of US stocks

Price / sales
Price / book
2.1×

Cheaper than 45% of US stocks

EV / EBITDA
−2.6×

Cheaper than 74% of US stocks

Growth & margins
Revenue growth (YoY)
Earnings growth (YoY)
Gross margin
Operating margin
0.0%

Higher than 35% of US stocks

Net margin
0.0%

Higher than 30% of US stocks

Returns & dividend
Return on equity
−42.9%

Higher than 23% of US stocks

Return on assets
−25.5%

Higher than 16% of US stocks

Dividend yield

Bars mark the percentile across the ~4,600 US stocks Ticker Nerd covers, among those reporting the figure.

Peers

OLMA vs competitors

The nearest names by industry and size, scored by the same model — like for like.

Its peer group, ranked by the same modelBiotechnology
CompanyMarket capTKN rank
OLMAOlema Pharmaceuticals, Inc.$1.0B
40
CGEMCullinan Therapeutics, Inc.$1.0B
69
EYPTEyePoint, Inc.$1.0B
24
LXRXLexicon Pharmaceuticals, Inc.$978.7M
98
DRTSAlpha Tau Medical Ltd.$1.0B
14
AVTXAvalo Therapeutics, Inc.$959.3M
66
ANROAlto Neuroscience, Inc.$1.1B
43
Market Radar

This page is one stock. Monday covers all of them.

Computed off the Friday close and sent before the US open.

Market Radar reports the week’s largest rank changes across roughly 4,600 US stocks, the factor behind each one, and where the market went. OLMA appears on the weeks it earns a place.

Free, every Monday. Unsubscribe any time.

FAQ

Frequently asked questions about OLMA stock

What is the OLMA stock price forecast for 2026-2027?

The 12 Wall Street analysts covering Olema Pharmaceuticals, Inc. have a median 12-month price target of $40, with estimates ranging from $23 to $62. These are third-party analyst estimates, not Ticker Nerd forecasts, and they are frequently wrong.

Is OLMA stock a buy right now?

Of the 12 analysts covering Olema Pharmaceuticals, Inc., 11 rate it a Buy, 1 a Hold and 0 a Sell. Ticker Nerd's systematic factor model ranks Olema Pharmaceuticals, Inc. 40 out of 100 across roughly 4,600 US stocks as at 1 Aug 2026. None of this is personal advice — it does not consider your circumstances.

How does Ticker Nerd's model rank OLMA?

As at 1 Aug 2026, Olema Pharmaceuticals, Inc. ranks 40 out of 100 on Ticker Nerd's systematic factor model — a percentile across roughly 4,600 US stocks, built from its factor families. Its strongest factor family is Quality (70 of 100).

Will OLMA stock go up?

No one can know that. What the data says: the median 12-month target from 12 analysts implies +254.6% from the last close, and Ticker Nerd's factor model ranks Olema Pharmaceuticals, Inc. 40 out of 100 as at 1 Aug 2026. Analyst targets are third-party estimates and frequently wrong; none of this is personal advice.

What is the OLMA stock forecast for 2030?

No analyst covering Olema Pharmaceuticals, Inc. publishes a 2030 price target — Wall Street targets run 12 to 18 months out. Sites quoting a 2030 price for OLMA are extrapolating price history, which says nothing about the business. The furthest attributed numbers are the current analyst targets: $23 to $62 over the next 12 months.

How has OLMA stock performed over the past year?

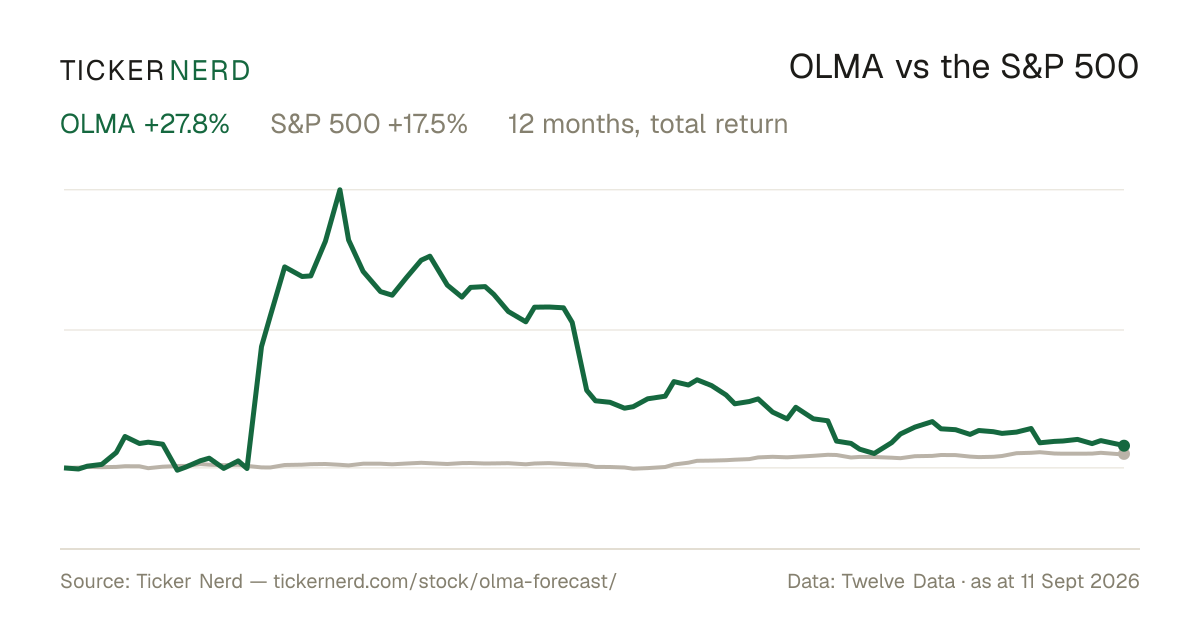
Olema Pharmaceuticals, Inc. returned +111.6% over the 12 months to 3 Aug 2026, with dividends reinvested. Past performance does not indicate future returns.

What does Olema Pharmaceuticals, Inc. do?

Olema Pharmaceuticals Inc. is a clinical-stage biopharmaceutical company focused on the discovery, development, and commercialization of targeted therapies for women's cancers, particularly breast cancer.

Company

About Olema Pharmaceuticals, Inc.

Olema Pharmaceuticals Inc. is a clinical-stage biopharmaceutical company focused on the discovery, development, and commercialization of targeted therapies for women's cancers, particularly breast cancer. Its lead product candidate, palazestrant (OP-1250), is an oral therapy that acts as both a complete estrogen receptor antagonist (CERAN) and a selective estrogen receptor degrader (SERD), designed for patients with recurrent, locally advanced, or metastatic estrogen receptor-positive (ER+), human epidermal growth factor receptor 2-negative (HER2-) breast cancer. Palazestrant is currently in the pivotal Phase 3 OPERA-01 trial as a monotherapy in second- and third-line settings, and in Phase 1/2 trials in combination with CDK4/6 inhibitors like palbociclib and ribociclib, as well as other agents such as PI3Ka inhibitor alpelisib and mTOR inhibitor everolimus. The company is also advancing OP-3136, an orally available small molecule that selectively inhibits KAT6, in Phase 1 trials for ER+/HER2- metastatic breast cancer and other solid tumors. Olema Pharmaceuticals Inc. operates in the oncology sector, addressing unmet needs in endocrine-driven cancers through innovative small molecule approaches. Founded in 2006 and headquartered in San Francisco, California, it emphasizes precision medicines to improve treatment outcomes in high-incidence markets.

CEO Dr. Sean P. Bohen M.D., Ph.D. · 137 employees · United States · https://olema.com