ORKAORKAHealthcare · Biotechnology

ORKA Stock Forecast: Oruka Therapeutics, Inc. Price Predictions for 2026-2027

Last close, 17 Nov 2026
$96
−2.94% on the day

The 13 Wall Street analysts covering Oruka Therapeutics, Inc. hold a median 12-month price target of $156 — +61.4% from the last close. Ticker Nerd's systematic factor model, run across ~4,600 US stocks, ranks it 37 of 100 as at 16 Nov 2026 — in the lower half. The Street sees upside; the factor read is a caution. That gap is the story on this page.

Market cap
$6.7B
Ticker Nerd rank
37/ 100
Median analyst target
$156
Analysts covering
13
Revenue$0.0
Operating income−$50.1M
Net income−$41.2M
Free cash flow−$33.1M
Quarterly, 8 quarters to 30 June 2026 · latest quarter's figure shown
Total return, dividends reinvested
1W
−12.0%
1M
+33.9%
YTD
+217.8%
1Y
+241.2%
From 52W high
−14.8%
From 52W low
+264.8%
$26
$113
52-week range, adjusted closes · the dot is the last close
Ticker Nerd rank

ORKA stock analysis: one number for the whole business

Consensus tells you what everyone already believes. The model scores Oruka Therapeutics, Inc. on its factor families — the same systematic rank behind the Ticker Nerd portfolio.

Where the model ranks itAs at 16 Nov 2026
37/ 100

Percentile across ~4,600 US stocks on Ticker Nerd’s systematic factor model. Higher is better. How the model is built and tested

Momentum
98
Value
82
Volatility
70
Quality
62
Growth
33
Revisions
30
Accruals
22
Issuance
21
Size
19

Momentum (98): The shares have been drifting up relative to others.

Issuance (21): The company has been issuing shares or taking on financing, diluting existing holders.

Size (19): Larger than most of the companies we track — more scrutinised, less often mispriced.

Built and run by Aslam Ghouse, an ex-Goldman Sachs systematic trader with 15+ years in markets.

Wall Street

ORKA stock forecast 2026-2027: analyst price targets & predictions

The bullish and bearish analyst opinions on ORKA, reported as data — targets and ratings, the market's view beside the model's.

Share price and the analyst range, 12 monthsAdjusted close, US dollars
$0$50$100$150$200Jan 26Apr 26Jul 26Oct 26ORKAHigh $200Median $156Low $117

Price targets and ratings are third-party analyst estimates, reported here as data. They are not Ticker Nerd forecasts, and they are frequently wrong.

Data provided by Twelve Data

What Wall Street says13 analysts
13 Buy0 Hold0 Sell
Low $117Median $156High $200

The green dot is the last close — the median target sits +61.4% from it.

Recent analyst actionsNewest first
DateFirmActionRatingTarget
10 Nov 2026BTIGReiteratesBuy$151
27 Oct 2026GuggenheimReiteratesBuy—
27 Oct 2026GuggenheimReiteratesBuy$200
27 Oct 2026WedbushReiteratesOutperform—
27 Oct 2026WedbushReiteratesOutperform$165
19 Oct 2026BTIGReiteratesBuy—
19 Oct 2026BTIGReiteratesBuy$151
24 Sept 2026HC Wainwright & Co.ReiteratesBuy—
24 Sept 2026HC Wainwright & Co.ReiteratesBuy$120
24 Sept 2026WedbushReiteratesOutperform—
24 Sept 2026WedbushReiteratesOutperform$165
3 Sept 2026HC Wainwright & Co.ReiteratesBuy$120
3 Sept 2026HC Wainwright & Co.ReiteratesBuy—
11 Aug 2026BTIGReiteratesBuy—
11 Aug 2026BTIGReiteratesBuy$151
11 Aug 2026GuggenheimReiteratesBuy—
11 Aug 2026GuggenheimReiteratesBuy$200
11 Aug 2026WedbushReiteratesOutperform$165
11 Aug 2026WedbushReiteratesOutperform—
3 Aug 2026HC Wainwright & Co.ReiteratesBuy$120

Price targets and ratings are third-party analyst estimates, reported here as data. They are not Ticker Nerd forecasts, and they are frequently wrong.

Market Radar

This page is one stock. Monday covers all of them.

ORKA appears in the Radar on the weeks it earns a place.

  • Market Radar, every Monday: the week's biggest rank moves across ~4,600 US stocks, and the reason for each.
  • The AI build-out map, free: every AI company we track on one page, with the model's Top picks in all four parts.

Free. Unsubscribe any time. Privacy

The AI build-out map
PDF
  • AI cloud capacity

    MSFTAMZNGOOGLORCL

  • AI chips

    NVDAAVGOAMDMU

  • AI networking and servers

    ANETDELLLITECRDO

  • Data centre power

    VRTCEGGEVVST

Performance

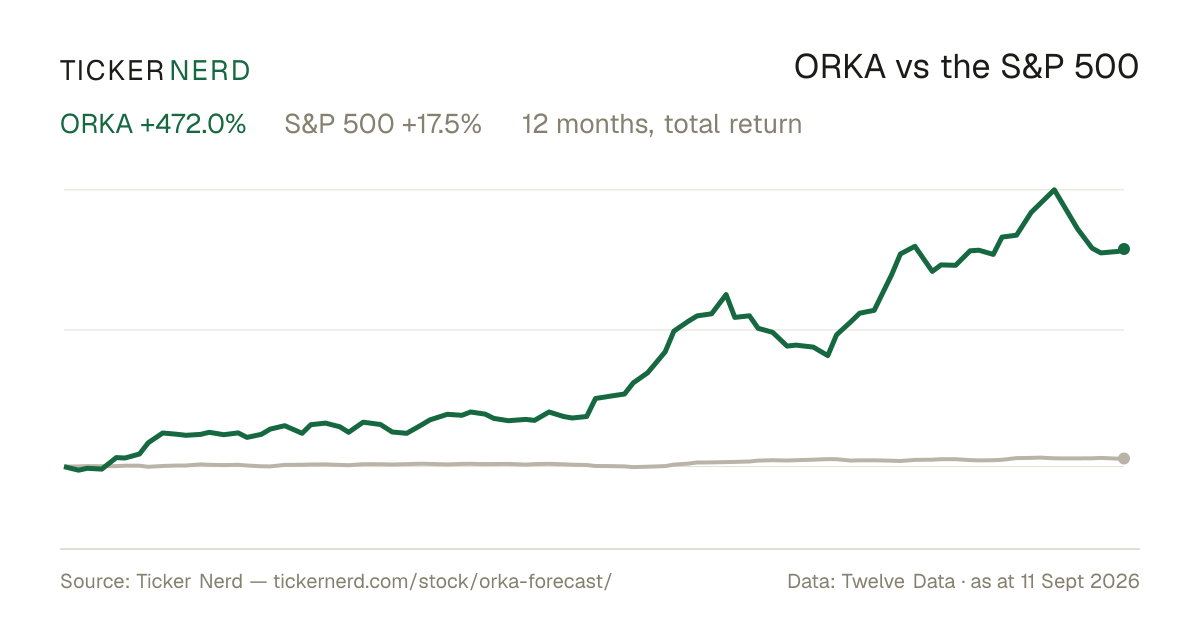
ORKA vs the S&P 500

Both lines are total return — dividends reinvested — so the comparison is honest on both sides.

Over the twelve months to 17 Nov 2026, Oruka Therapeutics, Inc. returned +241.2% against +11.2% for the S&P 500, dividends included.

ORKA vs S&P 500, last 12 monthsTotal return, rebased to 100
100200300400Jan 26Apr 26Jul 26Oct 26ORKAS&P 500

Download this chart as an image — free to reuse; link this page as the source.

Data provided by Twelve Data

Estimates

ORKA analyst estimate revisions

Not the forecast itself — the direction analysts are revising it. Revision direction is one of the model's factor families.

Which way the estimates are movingThis fiscal year
Analysts raising
1
Analysts cutting
8
Fundamentals

Oruka Therapeutics, Inc. (ORKA) financial data

A margin means little on its own. Each bar marks where the figure sits across the whole US universe we score.

Valuation
Trailing P/E
−53.6×

Cheaper than 99% of US stocks

Price / sales
—
Price / book
5.6×

Cheaper than 17% of US stocks

EV / EBITDA
−31.8×

Cheaper than 93% of US stocks

Growth & margins
Revenue growth (YoY)
—
Earnings growth (YoY)
—
Gross margin
—
Operating margin
0.0%

Higher than 33% of US stocks

Net margin
0.0%

Higher than 29% of US stocks

Returns & dividend
Return on equity
−18.1%

Higher than 32% of US stocks

Return on assets
−13.2%

Higher than 24% of US stocks

Dividend yield
0.0%

Higher than 1% of US dividend payers

Bars mark the percentile across the ~4,600 US stocks Ticker Nerd covers, among those reporting the figure.

Key statistics

Oruka Therapeutics, Inc. (ORKA) statistics: revenue, profit & scale

The headline figures, each with its date. Every row carries its own link — cite it straight from here.

  • Oruka Therapeutics, Inc. has a market value of $6.7B and an enterprise value of $5.8B.

  • Revenue in the twelve months to 30 June 2026: $0.0.

  • Net income over the same four quarters: −$132.9M.

  • Free cash flow in the twelve months to 30 June 2026: −$101.2M.

  • Shares outstanding: 61.1M.

  • Trailing P/E: −53.6×; forward P/E: −34.4× — the forward figure prices analyst consensus estimates, not reported earnings.

  • Forward dividend yield: 0.00%, paying out 0% of earnings.

  • Oruka Therapeutics, Inc. employs 68 people.

Statement figures: company filings via Twelve Data, four quarters to 30 June 2026 · market figures as at 17 Nov 2026

Data provided by Twelve Data

Peers

ORKA vs competitors

The nearest names by industry and size, scored by the same model — like for like.

Its peer group, ranked by the same modelBiotechnology
CompanyMarket capTKN rank
ORKAOruka Therapeutics, Inc.$6.7B37
KODKodiak Sciences, Inc.$6.6B59
IMVTImmunovant, Inc.$6.7B58
IBRXImmunityBio, Inc.$6.3B40
TWSTTwist Bioscience Corp.$6.9B62
ARWRArrowhead Pharmaceuticals, Inc.$6.2B41
AXSMAxsome Therapeutics, Inc.$7.1B73

Look up any of the roughly 4,600 stocks we score.

The rank is the raw material. Whether the rules would actually own Oruka Therapeutics, Inc. — and when they’d sell — is the membership. See the Ticker Nerd 20 →

News

Latest ORKA news & analysis

Oruka Therapeutics Reports Third Quarter 2026 Financial Results and Provides Corporate Update

GlobeNewsWire · 9 Nov 2026positive

Oruka Therapeutics reported third-quarter 2026 financial results and provided a corporate update. The company said EVERLAST-B Week 16 results for ORKA-001’s high-dose group showed 61% PASI 100 and 86% PASI 90, highly consistent with EVERLAST-A.

Why it matters — The update adds Week 16 clinical results for ORKA-001 that ORKA watchers can compare with the earlier EVERLAST-A findings.

Oruka Therapeutics to Participate in Multiple Upcoming Conferences

GlobeNewsWire · 3 Nov 2026neutral

Oruka Therapeutics announced that it will participate in and present at four healthcare and biopharma conferences from November 10 to 18, 2026. Webcasts and replays will be available on the company’s investor events website.

Why it matters — The conference presentations provide opportunities for ORKA watchers to follow the company’s updates and presentations.

Oruka's ORKA-001 Delivers 61% Complete Skin Clearance in Phase IIb Psoriasis Study

MarketBeat · 27 Oct 2026positive

Oruka Therapeutics reported interim week 16 results from its Phase IIb EVERLAST-B study of ORKA-001 in adults with moderate-to-severe plaque psoriasis. In the 600-milligram regimen, 61% of participants achieved PASI 100 and 86% achieved PASI 90.

Why it matters — The interim skin-clearance results provide ORKA watchers with an update on ORKA-001's performance in a Phase IIb psoriasis study.

FAQ

Frequently asked questions about ORKA stock

What is the ORKA stock price forecast for 2026-2027?

The 13 Wall Street analysts covering Oruka Therapeutics, Inc. have a median 12-month price target of $156, with estimates ranging from $117 to $200. These are third-party analyst estimates, not Ticker Nerd forecasts, and they are frequently wrong.

Is ORKA stock a buy right now?

Of the 13 analysts covering Oruka Therapeutics, Inc., 13 rate it a Buy, 0 a Hold and 0 a Sell. Ticker Nerd's systematic factor model ranks Oruka Therapeutics, Inc. 37 out of 100 across roughly 4,600 US stocks as at 16 Nov 2026. None of this is personal advice — it does not consider your circumstances.

How does Ticker Nerd's model rank ORKA?

As at 16 Nov 2026, Oruka Therapeutics, Inc. ranks 37 out of 100 on Ticker Nerd's systematic factor model — a percentile across roughly 4,600 US stocks, built from its factor families. Its strongest factor family is Momentum (98 of 100).

Will ORKA stock go up?

No one can know that. What the data says: the median 12-month target from 13 analysts implies +61.4% from the last close, and Ticker Nerd's factor model ranks Oruka Therapeutics, Inc. 37 out of 100 as at 16 Nov 2026. Analyst targets are third-party estimates and frequently wrong; none of this is personal advice.

What is the ORKA stock forecast for 2030?

No analyst covering Oruka Therapeutics, Inc. publishes a 2030 price target — Wall Street targets run 12 to 18 months out. Sites quoting a 2030 price for ORKA are extrapolating price history, which says nothing about the business. The furthest attributed numbers are the current analyst targets: $117 to $200 over the next 12 months.

How has ORKA stock performed over the past year?

Oruka Therapeutics, Inc. returned +241.2% over the 12 months to 17 Nov 2026, with dividends reinvested. Past performance does not indicate future returns.

What does Oruka Therapeutics, Inc. do?

Oruka Therapeutics, Inc. is a clinical-stage biopharmaceutical company focused on developing monoclonal antibody therapies for psoriasis and other inflammatory and immunology-related conditions.

What is the latest news on ORKA?

The most recent item we track (Seeking Alpha, 17 Nov 2026): "Oruka Therapeutics, Inc. (ORKA) Presents at UBS Global Biopharma Conference 2026 Transcript". Seeking Alpha published a transcript of Oruka Therapeutics’ presentation at the 2026 UBS Global Biopharma Conference.

Company

About Oruka Therapeutics, Inc.

Oruka Therapeutics, Inc. is a clinical-stage biopharmaceutical company focused on developing monoclonal antibody therapies for psoriasis and other inflammatory and immunology-related conditions. Its current pipeline centers on treatments designed to target key pathways involved in immune-mediated skin and joint diseases, including plaque psoriasis, psoriatic arthritis, and hidradenitis suppurativa. The company’s lead programs include ORKA-001, which targets the interleukin-23 p19 subunit, and ORKA-002, which targets interleukin-17A and interleukin-17F. Oruka Therapeutics is also advancing additional programs and combination regimens intended to broaden its dermatology and immunology portfolio. Headquartered in Menlo Park, California, Oruka Therapeutics plays a role in the biotech sector by developing targeted biologic medicines for chronic inflammatory diseases.

CEO Dr. Lawrence Otto Klein Ph.D. · 68 employees · United States · https://orukatx.com