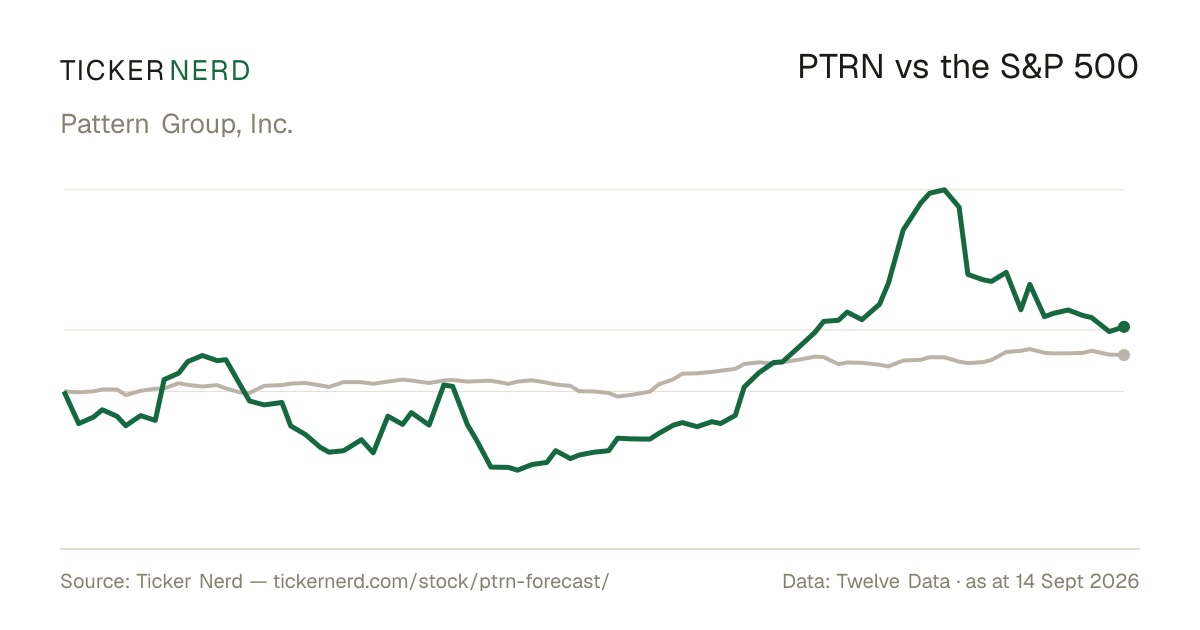
PTRN Stock Forecast: Pattern Group, Inc. Price Predictions for 2026-2027
The 9 Wall Street analysts covering Pattern Group, Inc. hold a median 12-month price target of $25 — +0.9% from the last close. Ticker Nerd's systematic factor model, run across ~4,600 US stocks, ranks it 20 of 100 as at 1 Aug 2026 — in the weakest quartile.
PTRN stock analysis: one number for the whole business
Consensus tells you what everyone already believes. The model scores Pattern Group, Inc. on its factor families — the same systematic rank behind the Ticker Nerd portfolio.
Percentile across ~4,600 US stocks on Ticker Nerd’s systematic factor model. Higher is better. How the model is built and tested
Revisions (96): Analysts have, on balance, been raising their forecasts.
Volatility (6): The share price moves around a lot.
The rank is the raw material. Whether the rules would actually own Pattern Group, Inc. — and when they’d sell — is the membership.
PTRN stock forecast 2026-2027: analyst price targets & predictions
The bullish and bearish analyst opinions on PTRN, reported as data — targets and ratings, the market's view beside the model's.
Price targets and ratings are third-party analyst estimates, reported here as data. They are not Ticker Nerd forecasts, and they are frequently wrong.
The green dot is the last close — the median target sits +0.9% from it.
Of the 20 most recent actions, 3 moved their price target up and 0 moved it down.
| Date | Firm | Action | Rating | Target |
|---|---|---|---|---|
| 14 July 2026 | Jefferies | Downgrade | Hold | $21 → $30 |
| 7 May 2026 | JP Morgan | Maintains | Overweight | $17 → $19 |
| 7 May 2026 | JP Morgan | Maintains | Overweight | — |
| 7 May 2026 | Needham | Maintains | Buy | $22 → $24 |
| 7 May 2026 | Needham | Maintains | Buy | — |
| 6 Mar 2026 | Baird | Maintains | Outperform | — |
| 6 Mar 2026 | JP Morgan | Maintains | Overweight | — |
| 6 Mar 2026 | Stifel | Maintains | Buy | — |
| 15 Jan 2026 | Needham | Reiterates | Buy | — |
| 6 Nov 2025 | Baird | Maintains | Outperform | — |
| 6 Nov 2025 | BMO Capital | Maintains | Outperform | — |
| 6 Nov 2025 | JP Morgan | Maintains | Overweight | — |
| 6 Nov 2025 | Keybanc | Maintains | Overweight | — |
| 6 Nov 2025 | Needham | Maintains | Buy | — |
| 14 Oct 2025 | Baird | Initiates | Outperform | — |
| 14 Oct 2025 | BMO Capital | Initiates | Outperform | — |
| 14 Oct 2025 | Evercore ISI Group | Initiates | Outperform | — |
| 14 Oct 2025 | Goldman Sachs | Initiates | Buy | — |
| 14 Oct 2025 | Jefferies | Initiates | Buy | — |
| 14 Oct 2025 | JP Morgan | Initiates | Overweight | — |
Price targets and ratings are third-party analyst estimates, reported here as data. They are not Ticker Nerd forecasts, and they are frequently wrong.
PTRN analyst estimate revisions
Not the forecast itself — the direction analysts are revising it. Revision direction is one of the model's factor families.
Pattern Group, Inc. (PTRN) financial data
A margin means little on its own. Each bar marks where the figure sits across the whole US universe we score.
- Trailing P/E
- 46.7×
- Price / sales
- 1.7×
- Price / book
- 6.7×
- EV / EBITDA
- 69.9×
Cheaper than 16% of US stocks
Cheaper than 57% of US stocks
Cheaper than 16% of US stocks
Cheaper than 3% of US stocks
- Revenue growth (YoY)
- 43.2%
- Earnings growth (YoY)
- 28.1%
- Gross margin
- 44.0%
- Operating margin
- 5.1%
- Net margin
- 0.8%
Higher than 85% of US stocks
Higher than 68% of US stocks
Higher than 56% of US stocks
Higher than 58% of US stocks
Higher than 49% of US stocks
- Return on equity
- 4.5%
- Return on assets
- 2.7%
- Dividend yield
- —
Higher than 52% of US stocks
Higher than 64% of US stocks
Bars mark the percentile across the ~4,600 US stocks Ticker Nerd covers, among those reporting the figure.
PTRN vs competitors
The nearest names by industry and size, scored by the same model — like for like.
This page is one stock. Monday covers all of them.
Computed off the Friday close and sent before the US open.
Market Radar reports the week’s largest rank changes across roughly 4,600 US stocks, the factor behind each one, and where the market went. PTRN appears on the weeks it earns a place.
Frequently asked questions about PTRN stock
What is the PTRN stock price forecast for 2026-2027?
The 9 Wall Street analysts covering Pattern Group, Inc. have a median 12-month price target of $25, with estimates ranging from $19 to $27. These are third-party analyst estimates, not Ticker Nerd forecasts, and they are frequently wrong.
Is PTRN stock a buy right now?
Of the 9 analysts covering Pattern Group, Inc., 8 rate it a Buy, 1 a Hold and 0 a Sell. Ticker Nerd's systematic factor model ranks Pattern Group, Inc. 20 out of 100 across roughly 4,600 US stocks as at 1 Aug 2026. None of this is personal advice — it does not consider your circumstances.
How does Ticker Nerd's model rank PTRN?
As at 1 Aug 2026, Pattern Group, Inc. ranks 20 out of 100 on Ticker Nerd's systematic factor model — a percentile across roughly 4,600 US stocks, built from its factor families. Its strongest factor family is Revisions (96 of 100).
Will PTRN stock go up?
No one can know that. What the data says: the median 12-month target from 9 analysts implies +0.9% from the last close, and Ticker Nerd's factor model ranks Pattern Group, Inc. 20 out of 100 as at 1 Aug 2026. Analyst targets are third-party estimates and frequently wrong; none of this is personal advice.
What is the PTRN stock forecast for 2030?
No analyst covering Pattern Group, Inc. publishes a 2030 price target — Wall Street targets run 12 to 18 months out. Sites quoting a 2030 price for PTRN are extrapolating price history, which says nothing about the business. The furthest attributed numbers are the current analyst targets: $19 to $27 over the next 12 months.
What does Pattern Group, Inc. do?
Pattern Group Inc. is an online retail platform specializing in the resale of consumer products by partnering with premium brands and leveraging marketplace giants like Amazon and Walmart for distribution.
About Pattern Group, Inc.
Pattern Group Inc. is an online retail platform specializing in the resale of consumer products by partnering with premium brands and leveraging marketplace giants like Amazon and Walmart for distribution. Founded in 2013 and headquartered in Lehi, Utah, the company is recognized for its proprietary technology platform powered by artificial intelligence and machine learning, which enables brands to accelerate profitable growth across more than 60 global ecommerce marketplaces. Pattern Group’s platform optimizes key ecommerce functions such as advertising, content management, pricing, forecasting, and customer service, helping brands expand their reach to consumers in over 100 countries. The company’s catalog encompasses diverse product categories including health and wellness, beauty and personal care, home and lifestyle, pet products, sports and outdoors, and consumer electronics. Pattern Group serves as a critical enabler for brands seeking to navigate and scale operations in the complex digital marketplace environment, cementing its role as a technology-driven leader in the global ecommerce sector.
CEO Mr. David Wright · 2,300 employees · United States · https://www.pattern.com