RILY Stock Forecast: BRC Group Holdings, Inc. Price Predictions for 2026-2027
Ticker Nerd's systematic factor model, run across ~4,600 US stocks, ranks it 81 of 100 as at 1 Aug 2026 — inside the top quartile.
RILY stock analysis: one number for the whole business
Consensus tells you what everyone already believes. The model scores BRC Group Holdings, Inc. on its factor families — the same systematic rank behind the Ticker Nerd portfolio.
Percentile across ~4,600 US stocks on Ticker Nerd’s systematic factor model. Higher is better. How the model is built and tested
Growth (100): Sales and profits are climbing, and climbing faster than before.
Accruals (14): A large share of reported profit has not shown up as cash, or the balance sheet is expanding quickly — both tend to unwind.
The rank is the raw material. Whether the rules would actually own BRC Group Holdings, Inc. — and when they’d sell — is the membership.
RILY stock forecast 2026-2027: analyst price targets & predictions
The bullish and bearish analyst opinions on RILY, reported as data — targets and ratings, the market's view beside the model's.
Price targets and ratings are third-party analyst estimates, reported here as data. They are not Ticker Nerd forecasts, and they are frequently wrong.
RILY analyst estimate revisions
Not the forecast itself — the direction analysts are revising it. Revision direction is one of the model's factor families.
BRC Group Holdings, Inc. (RILY) financial data
A margin means little on its own. Each bar marks where the figure sits across the whole US universe we score.
- Trailing P/E
- 0.5×
- Price / sales
- 0.3×
- Price / book
- 3.2×
- EV / EBITDA
- 3.7×
Cheaper than 71% of US stocks
Cheaper than 90% of US stocks
Cheaper than 32% of US stocks
Cheaper than 55% of US stocks
- Revenue growth (YoY)
- 113.4%
- Earnings growth (YoY)
- 78.0%
- Gross margin
- 81.3%
- Operating margin
- 40.2%
- Net margin
- 50.8%
Higher than 94% of US stocks
Higher than 83% of US stocks
Higher than 92% of US stocks
Higher than 93% of US stocks
Higher than 96% of US stocks
- Return on equity
- −248.9%
- Return on assets
- 28.6%
- Dividend yield
- 28.6%
Higher than 5% of US stocks
Higher than 99% of US stocks
Higher than 96% of US dividend payers
Bars mark the percentile across the ~4,600 US stocks Ticker Nerd covers, among those reporting the figure.
RILY vs competitors
The nearest names by industry and size, scored by the same model — like for like.
| Company | Market cap | TKN rank |
|---|---|---|
| RILYBRC Group Holdings, Inc. | $281.8M | 81 |
| TREELendingTree, Inc. | $444.5M | 81 |
| HTHHilltop Holdings, Inc. | $2.3B | 80 |
| IRHOIron Horse Acquisition II Corp.* | $287.8M | 23 |
| HCACHall Chadwick Acquisition Corp.* | $287.8M | 16 |
| GPACGeneral Purpose Acquisition Corp.* | $288.4M | 16 |
| LPCVLaunchpad Cadenza Acquisition Corp. I* | $287.2M | 15 |
* Nearest Financial Services names by size — few financial conglomerates companies of this scale trade in the US universe.
This page is one stock. Monday covers all of them.
Computed off the Friday close and sent before the US open.
Market Radar reports the week’s largest rank changes across roughly 4,600 US stocks, the factor behind each one, and where the market went. RILY appears on the weeks it earns a place.
Frequently asked questions about RILY stock
How does Ticker Nerd's model rank RILY?
As at 1 Aug 2026, BRC Group Holdings, Inc. ranks 81 out of 100 on Ticker Nerd's systematic factor model — a percentile across roughly 4,600 US stocks, built from its factor families. Its strongest factor family is Growth (100 of 100).
What is the RILY stock forecast for 2030?
No analyst covering BRC Group Holdings, Inc. publishes a 2030 price target — Wall Street targets run 12 to 18 months out. Sites quoting a 2030 price for RILY are extrapolating price history, which says nothing about the business.
How has RILY stock performed over the past year?
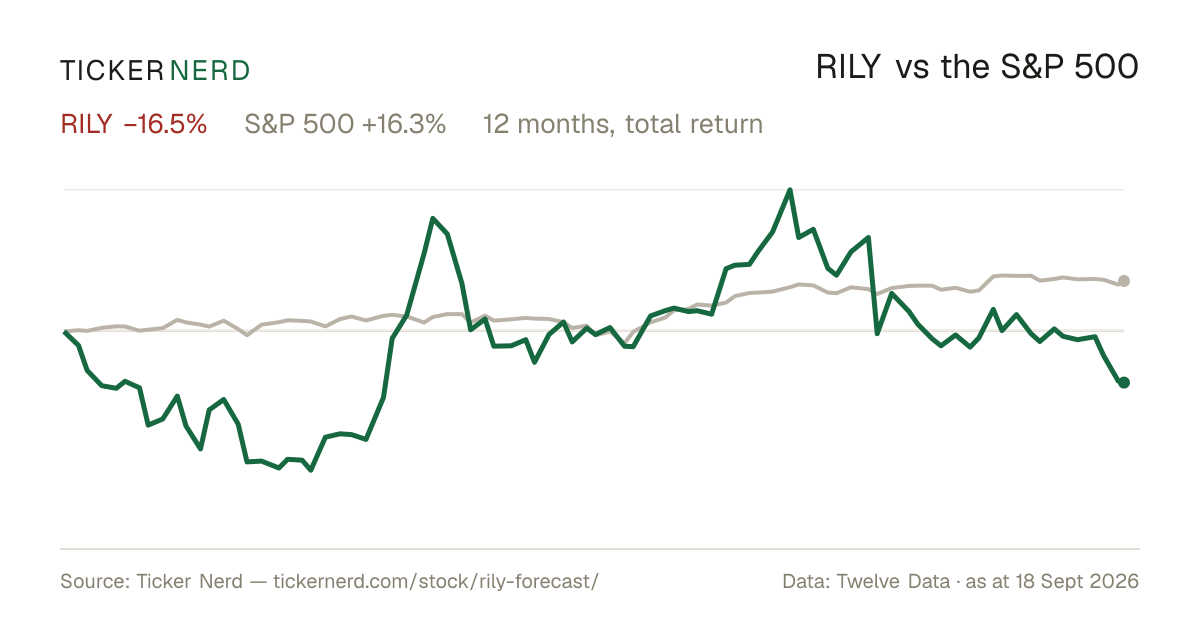
BRC Group Holdings, Inc. returned +46.9% over the 12 months to 3 Aug 2026, with dividends reinvested. Past performance does not indicate future returns.
What does BRC Group Holdings, Inc. do?
BRC Group Holdings, Inc. is a diversified holding company headquartered in Los Angeles, California, founded in 1973.
About BRC Group Holdings, Inc.
BRC Group Holdings, Inc. is a diversified holding company headquartered in Los Angeles, California, founded in 1973. It operates as a portfolio of distinct businesses across financial services, telecommunications, retail, and opportunistic investments in equity, debt, and venture capital. The company provides comprehensive solutions for small-cap and middle-market firms, including investment banking, capital markets services such as equity research, institutional sales, trading, mergers and acquisitions, restructuring advisory, and debt financing. Its wealth management arm delivers brokerage, investment management, insurance, and tax planning to high-net-worth clients. Additional segments encompass financial consulting with bankruptcy restructuring, forensic accounting, and valuation services; auction and liquidation for retail assets; communications offerings like broadband, VoIP through magicJack, and mobile services via brands such as NetZero and Juno; and consumer products including laptop accessories. Formerly B. Riley Financial, Inc., the name change to BRC Group Holdings, Inc. effective January 1, 2026, reflects its evolution into a multifaceted entity with dedicated management for each operating company, serving clients globally in North America, Australia, Asia Pacific, and Europe.
CEO Mr. Bryant Richard Riley · 1,380 employees · United States · https://www.brcgh.com