RTBTechnology · Software - Application

RTB Stock Forecast: RTB Digital, Inc. Price Predictions for 2026-2027

Last close, 3 Aug 2026
$16
−1.21% on the day

Ticker Nerd's systematic factor model, run across ~4,600 US stocks, ranks it 30 of 100 as at 1 Aug 2026 — in the lower half.

Market cap
$213.8M
Ticker Nerd rank
30 / 100
Median analyst target
Analysts covering
Total return, dividends reinvested
1W
−8.2%
1M
+4.8%
YTD
+177.0%
1Y
+70.4%
From 52W high
−19.6%
From 52W low
+363.0%
$3
$19
52-week range, adjusted closes · the dot is the last close
Ticker Nerd rank

RTB stock analysis: one number for the whole business

Consensus tells you what everyone already believes. The model scores RTB Digital, Inc. on its factor families — the same systematic rank behind the Ticker Nerd portfolio.

Where the model ranks itAs at 1 Aug 2026
30 / 100

Percentile across ~4,600 US stocks on Ticker Nerd’s systematic factor model. Higher is better. How the model is built and tested

Accruals
100
Size
67
Issuance
59
Quality
41
Momentum
38
Growth
38
Revisions
25
Value
14
Volatility
7

Accruals (100): Reported profit is backed by cash, and the company is not expanding recklessly.

Volatility (7): The share price moves around a lot.

The rank is the raw material. Whether the rules would actually own RTB Digital, Inc. — and when they’d sell — is the membership.

Wall Street

RTB stock forecast 2026-2027: analyst price targets & predictions

The bullish and bearish analyst opinions on RTB, reported as data — targets and ratings, the market's view beside the model's.

Share price and the analyst range, 12 monthsAdjusted close, US dollars
$5$10$15Oct 25Jan 26Apr 26Jul 26RTB

Price targets and ratings are third-party analyst estimates, reported here as data. They are not Ticker Nerd forecasts, and they are frequently wrong.

Price targets and ratings are third-party analyst estimates, reported here as data. They are not Ticker Nerd forecasts, and they are frequently wrong.

Estimates

RTB analyst estimate revisions

Not the forecast itself — the direction analysts are revising it. Revision direction is one of the model's factor families.

Fundamentals

RTB Digital, Inc. (RTB) financial data

A margin means little on its own. Each bar marks where the figure sits across the whole US universe we score.

Valuation
Trailing P/E
−5.2×

Cheaper than 90% of US stocks

Price / sales
111.7×

Cheaper than 4% of US stocks

Price / book
3.3×

Cheaper than 31% of US stocks

EV / EBITDA
−36.1×

Cheaper than 92% of US stocks

Growth & margins
Revenue growth (YoY)
−73.8%

Higher than 3% of US stocks

Earnings growth (YoY)
Gross margin
44.2%

Higher than 57% of US stocks

Operating margin
−34.3%

Higher than 20% of US stocks

Net margin
−113.2%

Higher than 5% of US stocks

Returns & dividend
Return on equity
−2623.7%

Higher than 1% of US stocks

Return on assets
−133.8%

Higher than 1% of US stocks

Dividend yield

Bars mark the percentile across the ~4,600 US stocks Ticker Nerd covers, among those reporting the figure.

Peers

RTB vs competitors

The nearest names by industry and size, scored by the same model — like for like.

Its peer group, ranked by the same modelSoftware - Application
CompanyMarket capTKN rank
RTBRTB Digital, Inc.$213.8M
30
KLTRKaltura, Inc.$214.2M
96
PERFPerfect Corp.$195.5M
73
SMRTSmartRent, Inc.$194.8M
64
ASURAsure Software, Inc.$222.9M
78
EXFYExpensify, Inc.$183.7M
68
EGANeGain Corp.$183.2M
97
Market Radar

This page is one stock. Monday covers all of them.

Computed off the Friday close and sent before the US open.

Market Radar reports the week’s largest rank changes across roughly 4,600 US stocks, the factor behind each one, and where the market went. RTB appears on the weeks it earns a place.

Free, every Monday. Unsubscribe any time.

FAQ

Frequently asked questions about RTB stock

How does Ticker Nerd's model rank RTB?

As at 1 Aug 2026, RTB Digital, Inc. ranks 30 out of 100 on Ticker Nerd's systematic factor model — a percentile across roughly 4,600 US stocks, built from its factor families. Its strongest factor family is Accruals (100 of 100).

What is the RTB stock forecast for 2030?

No analyst covering RTB Digital, Inc. publishes a 2030 price target — Wall Street targets run 12 to 18 months out. Sites quoting a 2030 price for RTB are extrapolating price history, which says nothing about the business.

How has RTB stock performed over the past year?

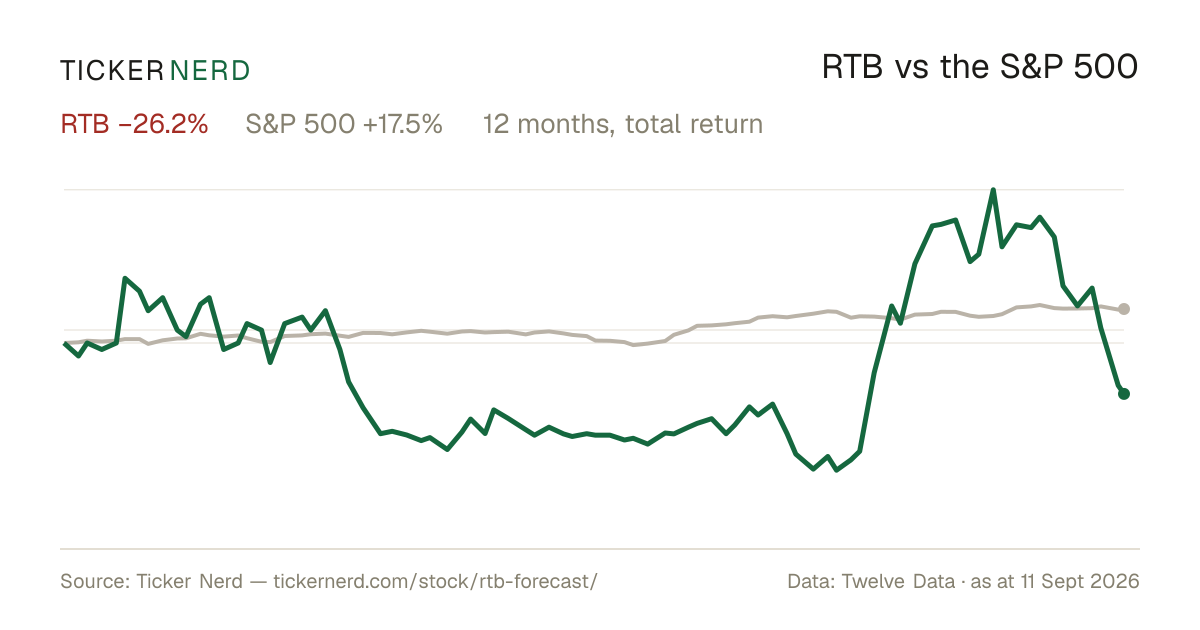
RTB Digital, Inc. returned +70.4% over the 12 months to 3 Aug 2026, with dividends reinvested. Past performance does not indicate future returns.

What does RTB Digital, Inc. do?

RTB Digital, Inc. is a media technology company that provides an enterprise platform for professional publishers, media brands, and sports-related content networks.

Company

About RTB Digital, Inc.

RTB Digital, Inc. is a media technology company that provides an enterprise platform for professional publishers, media brands, and sports-related content networks. Its current offering combines AI-driven workflow tools, decentralized finance infrastructure, and Web3-based publishing capabilities to support content distribution, data protection, revenue management, and operational coordination. The platform is designed to help media organizations manage syndication, audience data, intellectual property, reporting, and monetization within a unified system. RTB Digital, Inc. serves premium media clients and partners across digital publishing and sports media, including organizations that rely on large-scale content operations and branded content ecosystems. The company focuses on modernizing media infrastructure by connecting publishing, financial settlement, and business intelligence functions in one environment. As a publicly traded media software and infrastructure company, RTB Digital, Inc. occupies a niche role at the intersection of digital publishing, blockchain-enabled services, and enterprise media operations.

CEO Mr. James Charles Heckman Jr. · United States · https://rtb.io