SIGSIGConsumer Cyclical · Luxury Goods

SIG Stock Forecast: Signet Jewelers Ltd. Price Predictions for 2026-2027

Last close, 8 Sept 2026
$83
−3.08% on the day

The 11 Wall Street analysts covering Signet Jewelers Ltd. hold a median 12-month price target of $101 — +22.2% from the last close. Ticker Nerd's systematic factor model, run across ~4,600 US stocks, ranks it 88 of 100 as at 7 Sept 2026 — inside the top quartile. Here, the model and the Street point the same way.

Market cap
$3.4B
Ticker Nerd rank
88 / 100
Median analyst target
$101
Analysts covering
11
Revenue$1.6B+0.8% y/y
Operating income$45.9M
Net income$31.7M
Free cash flow−$169.2M
Quarterly, 8 quarters to 30 Apr 2026 · latest quarter's figure shown
Total return, dividends reinvested
1W
+0.5%
1M
−14.7%
YTD
+0.5%
1Y
−10.1%
From 52W high
−21.4%
From 52W low
+12.2%
$74
$105
52-week range, adjusted closes · the dot is the last close
Ticker Nerd rank

SIG stock analysis: one number for the whole business

Consensus tells you what everyone already believes. The model scores Signet Jewelers Ltd. on its factor families — the same systematic rank behind the Ticker Nerd portfolio.

Where the model ranks itAs at 7 Sept 2026
88 / 100

Percentile across ~4,600 US stocks on Ticker Nerd’s systematic factor model. Higher is better. How the model is built and tested

Value
95
Accruals
79
Issuance
75
Growth
73
Volatility
70
Revisions
67
Momentum
63
Quality
51
Size
29

Value (95): The shares cost little relative to the profits and assets behind them — which can mean the market is too gloomy, or that the business really is in trouble.

Quality (51): Profits are thin or unreliable for the size of the business, or they are not turning into cash.

Size (29): Larger than most of the companies we track — more scrutinised, less often mispriced.

Built and run by Aslam Ghouse, an ex-Goldman Sachs quant trader with fourteen years in markets.

Wall Street

SIG stock forecast 2026-2027: analyst price targets & predictions

The bullish and bearish analyst opinions on SIG, reported as data — targets and ratings, the market's view beside the model's.

Share price and the analyst range, 12 monthsAdjusted close, US dollars
$60$80$100$120$140$160Oct 25Jan 26Apr 26Jul 26SIGHigh $150Median $101Low $89

Price targets and ratings are third-party analyst estimates, reported here as data. They are not Ticker Nerd forecasts, and they are frequently wrong.

Data provided by Twelve Data

What Wall Street says11 analysts
5 Buy6 Hold0 Sell
Low $89Median $101High $150

The green dot is the last close — the median target sits +22.2% from it.

Recent analyst actionsNewest first

Of the 20 most recent actions, 2 moved their price target up and 1 moved it down.

DateFirmActionRatingTarget
24 Aug 2026UBSMaintainsBuy$121$122
23 July 2026Raymond JamesInitiatesOutperform
23 July 2026Raymond JamesInitiatesOutperform$105
3 June 2026CitigroupMaintainsBuy$110$120
3 June 2026CitigroupMaintainsBuy
3 June 2026Wells FargoMaintainsEqual-Weight
3 June 2026Wells FargoMaintainsEqual-Weight$100$90
29 May 2026Stephens & Co.ReiteratesOverweight
29 May 2026Stephens & Co.ReiteratesOverweight$130
22 May 2026UBSMaintainsBuy
20 Mar 2026Telsey Advisory GroupMaintainsMarket Perform
20 Mar 2026UBSMaintainsBuy
20 Mar 2026Wells FargoMaintainsEqual-Weight
19 Mar 2026Telsey Advisory GroupMaintainsMarket Perform
10 Mar 2026Telsey Advisory GroupMaintainsMarket Perform
10 Mar 2026UBSMaintainsBuy
11 Dec 2025Goldman SachsInitiatesNeutral
10 Dec 2025JefferiesMaintainsBuy
3 Dec 2025Telsey Advisory GroupMaintainsMarket Perform
3 Dec 2025UBSMaintainsBuy

Price targets and ratings are third-party analyst estimates, reported here as data. They are not Ticker Nerd forecasts, and they are frequently wrong.

Market Radar

This page is one stock. Monday covers all of them.

Computed off the Friday close and sent before the US open.

Market Radar reports the week’s largest rank changes across roughly 4,600 US stocks, the factor behind each one, and where the market went. SIG appears on the weeks it earns a place.

Free, every Monday. Unsubscribe any time.

Performance

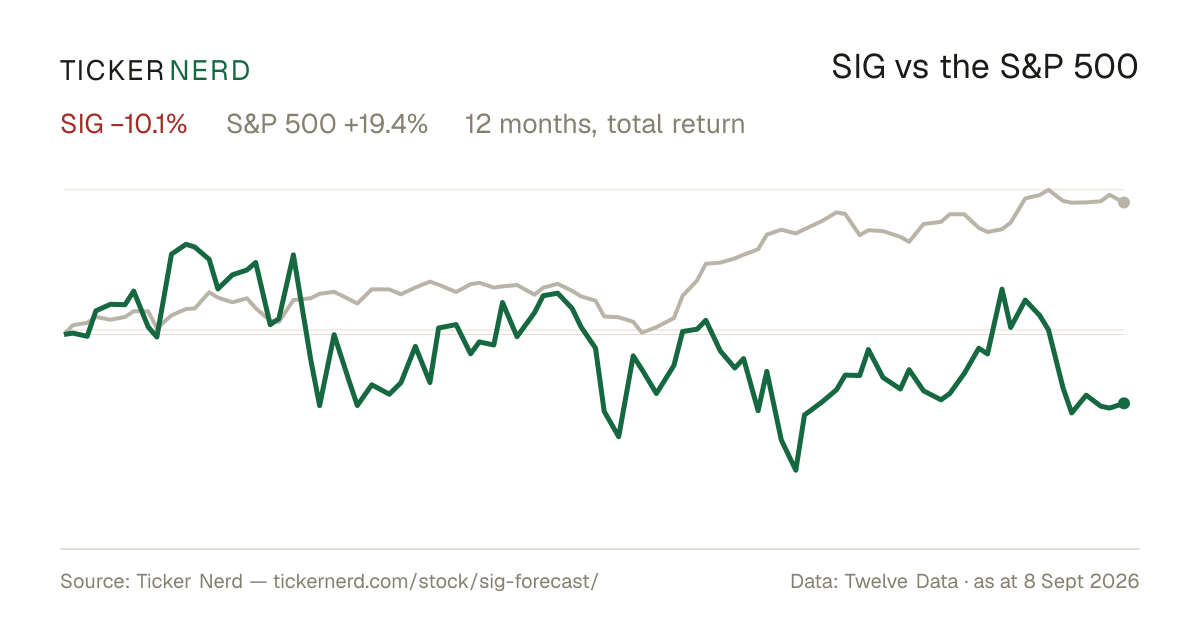
SIG vs the S&P 500

Both lines are total return — dividends reinvested — so the comparison is honest on both sides.

Over the twelve months to 8 Sept 2026, Signet Jewelers Ltd. returned −10.1% against +19.4% for the S&P 500, dividends included.

SIG vs S&P 500, last 12 monthsTotal return, rebased to 100
8090100110120Oct 25Jan 26Apr 26Jul 26SIGS&P 500

Download this chart as an image — free to reuse; link this page as the source.

Data provided by Twelve Data

Estimates

SIG analyst estimate revisions

Not the forecast itself — the direction analysts are revising it. Revision direction is one of the model's factor families.

Which way the estimates are movingNext fiscal year
EPS revision, 90 days
+0.6%
Analysts raising
2
Analysts cutting
0
Fundamentals

Signet Jewelers Ltd. (SIG) financial data

A margin means little on its own. Each bar marks where the figure sits across the whole US universe we score.

Valuation
Trailing P/E
12.0×

Cheaper than 54% of US stocks

Price / sales
0.5×

Cheaper than 83% of US stocks

Price / book
1.8×

Cheaper than 50% of US stocks

EV / EBITDA
6.4×

Cheaper than 50% of US stocks

Growth & margins
Revenue growth (YoY)
0.8%

Higher than 29% of US stocks

Earnings growth (YoY)
−5.4%

Higher than 30% of US stocks

Gross margin
35.8%

Higher than 44% of US stocks

Operating margin
5.1%

Higher than 55% of US stocks

Net margin
4.3%

Higher than 58% of US stocks

Returns & dividend
Return on equity
15.9%

Higher than 76% of US stocks

Return on assets
6.1%

Higher than 81% of US stocks

Dividend yield
1.6%

Higher than 38% of US dividend payers

Bars mark the percentile across the ~4,600 US stocks Ticker Nerd covers, among those reporting the figure.

Key statistics

Signet Jewelers Ltd. (SIG) statistics: revenue, profit & scale

The headline figures, each with its date. Every row carries its own link — cite it straight from here.

  • Signet Jewelers Ltd. has a market value of $3.4B and an enterprise value of $4.0B.

  • Revenue in the twelve months to 30 Apr 2026: $6.8B. The latest quarter grew 0.8% year on year.

  • Net income over the same four quarters: $292.6M, a 4.3% net margin.

  • Diluted earnings per share, trailing twelve months: $7.13.

  • Free cash flow in the twelve months to 30 Apr 2026: $568.0M.

  • Signet Jewelers Ltd. spent $170.5M on share buybacks and $52.3M on dividends in the twelve months to 30 Apr 2026.

  • Shares outstanding: 39.7M.

  • Trailing P/E: 12.0×; forward P/E: 6.9× — the forward figure prices analyst consensus estimates, not reported earnings.

  • Forward dividend yield: 1.64%, paying out 19% of earnings.

  • Signet Jewelers Ltd. employs 27,097 people $252K of revenue per employee.

Statement figures: company filings via Twelve Data, four quarters to 30 Apr 2026 · market figures as at 8 Sept 2026

Data provided by Twelve Data

Peers

SIG vs competitors

The nearest names by industry and size, scored by the same model — like for like.

Its peer group, ranked by the same modelLuxury Goods
CompanyMarket capTKN rank
SIGSignet Jewelers Ltd.$3.4B
88
CPRICapri Holdings Ltd.$1.6B
50
REALThe RealReal, Inc.$1.2B
86
MOVMovado Group, Inc.$532.7M
99
TPRTapestry, Inc.$24.7B
94
ELAEnvela Corp.$365.3M
83
BFAMBright Horizons Family Solutions, Inc.*$3.4B
62

* Nearest Consumer Cyclical names by size — few luxury goods companies of this scale trade in the US universe.

Look up any of the roughly 4,600 stocks we score.

The rank is the raw material. Whether the rules would actually own Signet Jewelers Ltd. — and when they’d sell — is the membership. See the Ticker Nerd 20 →

News

Latest SIG news & analysis

Signet Jewelers, Casey's General Stores and 3 Stocks to Watch Heading Into Wednesday

Benzinga · 9 Sept 2026neutral

Benzinga's article lists Signet Jewelers among stocks to watch on Wednesday, noting that U.S. stock futures were trading mixed that morning. The piece highlights the company as one that may draw investor focus for the day.

Why it matters — This flag signals that SIG is on investors' radar heading into the trading day amid a mixed futures market, marking it as a name to monitor.

Signet Gears Up For Q2 Print; Here Are The Recent Forecast Changes From Wall Street's Most Accurate Analysts

Benzinga · 9 Sept 2026neutral

Signet Jewelers Limited will report its fiscal second-quarter earnings before the market opens on Wednesday, Sept. 9. The report highlights recent forecast revisions from Wall Street analysts regarded as most accurate.

Why it matters — A SIG watcher would care because the upcoming earnings release and analyst forecast changes provide a key barometer for the company's recent performance and near-term outlook.

How To Earn $500 A Month From Signet Jewelers Stock Ahead Of Q2 Earnings

Benzinga · 8 Sept 2026neutral

Signet Jewelers Limited is scheduled to release its second-quarter earnings before the opening bell on Wednesday, Sept. 9. The article discusses how investors might earn $500 a month from Signet Jewelers stock ahead of that earnings release.

Why it matters — The upcoming second-quarter earnings release is a key event for investors tracking Signet Jewelers' financial performance.

Exploring Analyst Estimates for Signet (SIG) Q2 Earnings, Beyond Revenue and EPS

Zacks Investment Research · 3 Sept 2026neutral

Zacks Investment Research explores analyst estimates for Signet's Q2 earnings (quarter ending July 2026), looking beyond top-and-bottom-line figures to examine key metrics for deeper insight into expected performance.

Why it matters — Signet watchers gain a deeper look beyond standard revenue and EPS projections into the specific metrics that shape the company's quarterly earnings expectations.

Signet (SIG) Declines More Than Market: Some Information for Investors

Zacks Investment Research · 1 Sept 2026negative

Signet Jewelers shares declined 1.24% in the latest trading session, closing at $81.26, a drop that was larger than the broader market's move. The decline reflects a weaker day for the stock relative to the overall market.

Why it matters — A SIG watcher would note that the stock underperformed the broader market in the session, potentially signaling investor caution or sector-specific pressure.

FAQ

Frequently asked questions about SIG stock

What is the SIG stock price forecast for 2026-2027?

The 11 Wall Street analysts covering Signet Jewelers Ltd. have a median 12-month price target of $101, with estimates ranging from $89 to $150. These are third-party analyst estimates, not Ticker Nerd forecasts, and they are frequently wrong.

Is SIG stock a buy right now?

Of the 11 analysts covering Signet Jewelers Ltd., 5 rate it a Buy, 6 a Hold and 0 a Sell. Ticker Nerd's systematic factor model ranks Signet Jewelers Ltd. 88 out of 100 across roughly 4,600 US stocks as at 7 Sept 2026. None of this is personal advice — it does not consider your circumstances.

How does Ticker Nerd's model rank SIG?

As at 7 Sept 2026, Signet Jewelers Ltd. ranks 88 out of 100 on Ticker Nerd's systematic factor model — a percentile across roughly 4,600 US stocks, built from its factor families. Its strongest factor family is Value (95 of 100).

Will SIG stock go up?

No one can know that. What the data says: the median 12-month target from 11 analysts implies +22.2% from the last close, and Ticker Nerd's factor model ranks Signet Jewelers Ltd. 88 out of 100 as at 7 Sept 2026. Analyst targets are third-party estimates and frequently wrong; none of this is personal advice.

What is the SIG stock forecast for 2030?

No analyst covering Signet Jewelers Ltd. publishes a 2030 price target — Wall Street targets run 12 to 18 months out. Sites quoting a 2030 price for SIG are extrapolating price history, which says nothing about the business. The furthest attributed numbers are the current analyst targets: $89 to $150 over the next 12 months.

How has SIG stock performed over the past year?

Signet Jewelers Ltd. returned -10.1% over the 12 months to 8 Sept 2026, with dividends reinvested. Past performance does not indicate future returns.

What does Signet Jewelers Ltd. do?

Signet Jewelers Limited is a specialty jewelry retailer focused on diamond jewelry, bridal collections, fashion pieces, watches, and related services. The company operates a broad retail and e-commerce platform across North America and the United Kingdom and Ireland, serving customers through well-known brands such as Kay Jewelers, Zales, Jared, Banter by Piercing Pagoda, Diamonds Direct, Blue Nile, James Allen, Peoples Jewellers, H.Samuel, and Ernest Jones.

What is the latest news on SIG?

The most recent item we track (Benzinga, 9 Sept 2026): "Signet Jewelers, Casey's General Stores and 3 Stocks to Watch Heading Into Wednesday". Benzinga's article lists Signet Jewelers among stocks to watch on Wednesday, noting that U.S. stock futures were trading mixed that morning. The piece highlights the company as one that may draw investor focus for the day.

Company

About Signet Jewelers Ltd.

Signet Jewelers Limited is a specialty jewelry retailer focused on diamond jewelry, bridal collections, fashion pieces, watches, and related services. The company operates a broad retail and e-commerce platform across North America and the United Kingdom and Ireland, serving customers through well-known brands such as Kay Jewelers, Zales, Jared, Banter by Piercing Pagoda, Diamonds Direct, Blue Nile, James Allen, Peoples Jewellers, H.Samuel, and Ernest Jones. Its business also includes jewelry repair, maintenance, customization, piercing, and protection plans, alongside diamond sourcing and polishing activities. Signet Jewelers Limited plays a significant role in the consumer luxury and specialty retail market by combining store-based shopping with digital commerce to support everyday purchases, milestone occasions, and gifting needs.

CEO Mr. James Kevin Symancyk · 27,097 employees · Bermuda · https://www.signetjewelers.com