SOLSSOLSBasic Materials · Specialty Chemicals

SOLS Stock Forecast: Solstice Advanced Materials, Inc. Price Predictions for 2026-2027

Last close, 13 Nov 2026
$66
−0.57% on the day

The 10 Wall Street analysts covering Solstice Advanced Materials, Inc. hold a median 12-month price target of $76 — +14.9% from the last close. Ticker Nerd's systematic factor model, run across ~4,600 US stocks, ranks it 15 of 100 as at 13 Nov 2026 — in the weakest quartile. The Street sees upside; the factor read is a caution. That gap is the story on this page.

Market cap
$10.5B
Ticker Nerd rank
15/ 100
Median analyst target
$76
Analysts covering
10
Revenue$1.1B+11.1% y/y
Operating income$222.0M
Net income$134.0M
Free cash flow$123.0M
Quarterly, 8 quarters to 30 June 2026 · latest quarter's figure shown
Total return, dividends reinvested
1W
+14.0%
1M
+8.6%
YTD
+36.6%
1Y
+45.1%
From 52W high
−25.3%
From 52W low
+60.1%
$41
$88
52-week range, adjusted closes · the dot is the last close
Ticker Nerd rank

SOLS stock analysis: one number for the whole business

Consensus tells you what everyone already believes. The model scores Solstice Advanced Materials, Inc. on its factor families — the same systematic rank behind the Ticker Nerd portfolio.

Where the model ranks itAs at 13 Nov 2026
15/ 100

Percentile across ~4,600 US stocks on Ticker Nerd’s systematic factor model. Higher is better. How the model is built and tested

Revisions
77
Accruals
66
Quality
63
Value
31
Size
15
Issuance
14
Momentum
5
Volatility
4
Growth
3

Revisions (77): Analysts have, on balance, been raising their forecasts.

Growth (3): Sales and profits are flat, shrinking, or growing more slowly than they were.

Built and run by Aslam Ghouse, an ex-Goldman Sachs systematic trader with 15+ years in markets.

Wall Street

SOLS stock forecast 2026-2027: analyst price targets & predictions

The bullish and bearish analyst opinions on SOLS, reported as data — targets and ratings, the market's view beside the model's.

Share price and the analyst range, 12 monthsAdjusted close, US dollars
$40$50$60$70$80$90Jan 26Apr 26Jul 26Oct 26SOLSHigh $87Median $76Low $70

Price targets and ratings are third-party analyst estimates, reported here as data. They are not Ticker Nerd forecasts, and they are frequently wrong.

Data provided by Twelve Data

What Wall Street says10 analysts
9 Buy1 Hold0 Sell
Low $70Median $76High $87

The green dot is the last close — the median target sits +14.9% from it.

Recent analyst actionsNewest first

Of the 20 most recent actions, 1 moved their price target up and 6 moved it down.

DateFirmActionRatingTarget
13 Oct 2026BarclaysInitiatesOverweight$73
7 Oct 2026Seaport GlobalInitiatesBuy$80
5 Oct 2026UBSMaintainsBuy$80 → $76
5 Oct 2026UBSMaintainsBuy—
1 Oct 2026MizuhoMaintainsNeutral$70 → $65
1 Oct 2026MizuhoMaintainsNeutral—
30 Sept 2026RBC CapitalReiteratesOutperform$82
30 Sept 2026RBC CapitalReiteratesOutperform—
3 Sept 2026JefferiesInitiatesBuy—
3 Sept 2026JefferiesInitiatesBuy$86
31 July 2026RBC CapitalMaintainsOutperform—
31 July 2026RBC CapitalMaintainsOutperform$102 → $82
31 July 2026UBSMaintainsBuy$78 → $80
31 July 2026UBSMaintainsBuy—
16 July 2026BMO CapitalMaintainsOutperform$101 → $90
16 July 2026BMO CapitalMaintainsOutperform—
15 July 2026MizuhoMaintainsNeutral$95 → $70
15 July 2026MizuhoMaintainsNeutral—
13 July 2026UBSUpgradeBuy—
13 July 2026UBSUpgradeBuy$88 → $78

Price targets and ratings are third-party analyst estimates, reported here as data. They are not Ticker Nerd forecasts, and they are frequently wrong.

Market Radar

This page is one stock. Monday covers all of them.

SOLS appears in the Radar on the weeks it earns a place.

  • Market Radar, every Monday: the week's biggest rank moves across ~4,600 US stocks, and the reason for each.
  • The AI build-out map, free: every AI company we track on one page, with the model's Top picks in all four parts.

Free. Unsubscribe any time. Privacy

The AI build-out map
PDF
  • AI cloud capacity

    MSFTAMZNGOOGLORCL

  • AI chips

    NVDAAVGOAMDMU

  • AI networking and servers

    ANETDELLLITECRDO

  • Data centre power

    VRTCEGGEVVST

Performance

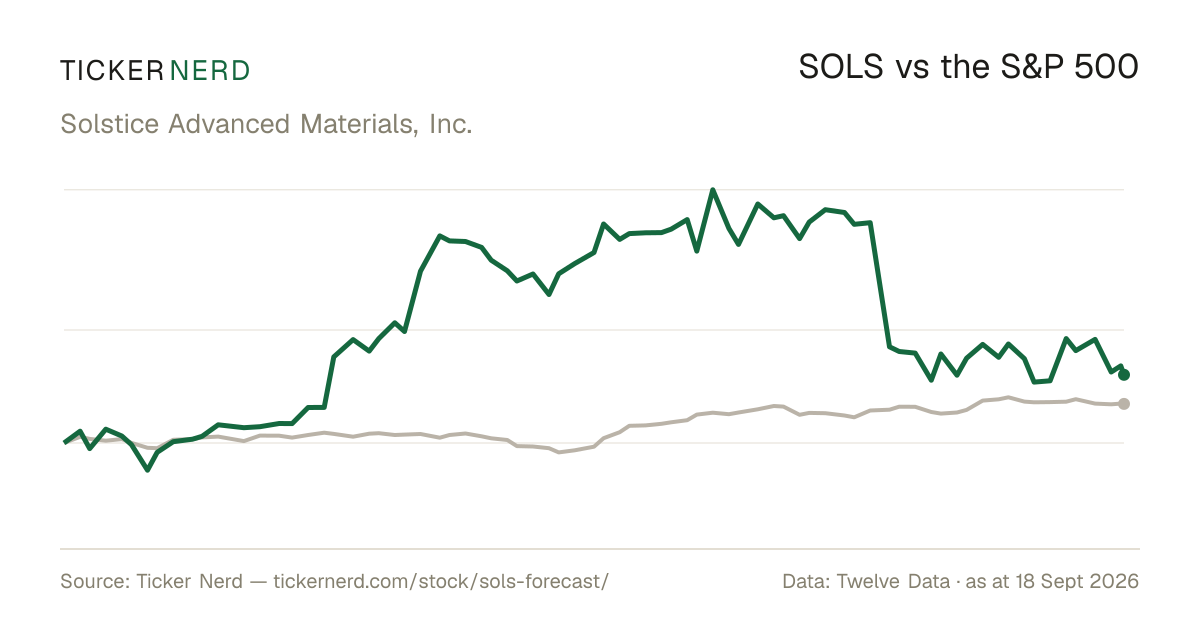
SOLS vs the S&P 500

Both lines are total return — dividends reinvested — so the comparison is honest on both sides.

Over the twelve months to 13 Nov 2026, Solstice Advanced Materials, Inc. returned +45.1% against +13.4% for the S&P 500, dividends included.

SOLS vs S&P 500, last 12 monthsTotal return, rebased to 100
80100120140160180200Jan 26Apr 26Jul 26Oct 26SOLSS&P 500

Download this chart as an image — free to reuse; link this page as the source.

Data provided by Twelve Data

Estimates

SOLS analyst estimate revisions

Not the forecast itself — the direction analysts are revising it. Revision direction is one of the model's factor families.

Which way the estimates are movingThis fiscal year
EPS revision, 90 days
+1.4%
Analysts raising
1
Analysts cutting
1
Fundamentals

Solstice Advanced Materials, Inc. (SOLS) financial data

A margin means little on its own. Each bar marks where the figure sits across the whole US universe we score.

Valuation
Trailing P/E
32.1×

Cheaper than 23% of US stocks

Price / sales
2.5×

Cheaper than 45% of US stocks

Price / book
6.6×

Cheaper than 14% of US stocks

EV / EBITDA
13.2×

Cheaper than 27% of US stocks

Growth & margins
Revenue growth (YoY)
7.9%

Higher than 48% of US stocks

Earnings growth (YoY)
11.1%

Higher than 51% of US stocks

Gross margin
32.2%

Higher than 37% of US stocks

Operating margin
17.2%

Higher than 77% of US stocks

Net margin
7.8%

Higher than 65% of US stocks

Returns & dividend
Return on equity
16.0%

Higher than 76% of US stocks

Return on assets
7.9%

Higher than 87% of US stocks

Dividend yield
0.5%

Higher than 65% of US dividend payers

Bars mark the percentile across the ~4,600 US stocks Ticker Nerd covers, among those reporting the figure.

Key statistics

Solstice Advanced Materials, Inc. (SOLS) statistics: revenue, profit & scale

The headline figures, each with its date. Every row carries its own link — cite it straight from here.

  • Solstice Advanced Materials, Inc. has a market value of $10.5B and an enterprise value of $12.2B.

  • Revenue in the twelve months to 30 June 2026: $4.1B. The latest quarter grew 7.9% year on year.

  • Net income over the same four quarters: $284.0M, a 6.9% net margin.

  • Diluted earnings per share, trailing twelve months: $1.32.

  • Free cash flow in the twelve months to 30 June 2026: $179.0M, after $411.0M of capital spending.

  • Shares outstanding: 158.8M.

  • Trailing P/E: 32.1×; forward P/E: 19.5× — the forward figure prices analyst consensus estimates, not reported earnings.

  • Forward dividend yield: 0.46%, paying out 11% of earnings.

  • Solstice Advanced Materials, Inc. employs 4,100 people — $999K of revenue per employee.

Statement figures: company filings via Twelve Data, four quarters to 30 June 2026 · market figures as at 13 Nov 2026

Data provided by Twelve Data

Peers

SOLS vs competitors

The nearest names by industry and size, scored by the same model — like for like.

Its peer group, ranked by the same modelSpecialty Chemicals
CompanyMarket capTKN rank
SOLSSolstice Advanced Materials, Inc.$10.5B15
ALBAlbemarle Corp.$11.0B76
RPMRPM International, Inc.$13.3B67
WLKWestlake Corp.$8.2B24
ESIElement Solutions, Inc.$8.1B61
AXTAAxalta Coating Systems Ltd.$7.8B75
EMNEastman Chemical Co.$7.4B50

Look up any of the roughly 4,600 stocks we score.

The rank is the raw material. Whether the rules would actually own Solstice Advanced Materials, Inc. — and when they’d sell — is the membership. See the Ticker Nerd 20 →

News

Latest SOLS news & analysis

Solstice Advanced Materials Reaches Key Development Milestone for Next-Generation Foam Blowing Agent

PRNewsWire · 9 Nov 2026positive

Solstice announced a key development milestone for a next-generation foam blowing agent and plans to begin sampling the developmental candidate with selected global customers in early 2027. The company said its internal evaluation indicates the candidate would not be classified as PFAS.

Why it matters — The milestone and planned customer sampling provide an update on Solstice’s product development and innovation pipeline.

Solstice Advanced Materials, Inc. (SOLS) Q3 2026 Earnings Call Transcript

Seeking Alpha · 5 Nov 2026neutral

Seeking Alpha published a transcript of Solstice Advanced Materials, Inc.’s Q3 2026 earnings call. The excerpt provides no details about the discussion.

Why it matters — The transcript may be relevant to SOLS watchers, but the provided excerpt does not specify any results or management commentary.

What Solstice Advanced Mat (SOLS) Said on Its Q3 Earnings Call

MarketBeat · 4 Nov 2026positive

Solstice Advanced Materials reported third-quarter 2026 results that exceeded its sales guidance, with growth in electronic materials, refrigerants and healthcare packaging. It raised its full-year outlook for the second consecutive quarter, citing portfolio momentum and improved operating leverage.

Why it matters — The results and higher outlook provide SOLS watchers an update on sales performance and the company’s expectations for the full year.

Solstice boosts annual forecast after AI-driven demand drives quarterly beat

Reuters · 4 Nov 2026positive

Solstice Advanced Materials raised its full-year adjusted profit and sales forecasts after strong data-center demand for nuclear, refrigerant and electronic materials helped it exceed third-quarter estimates.

Why it matters — The forecast increase and quarterly beat indicate that data-center demand is contributing to Solstice’s reported results.

Solstice Advanced Materials Reports Third Quarter 2026 Results

PRNewsWire · 4 Nov 2026positive

Solstice Advanced Materials reported third-quarter 2026 net sales of $1.046 billion, up 8% year over year and above guidance, with net income of $80 million and adjusted EBITDA of $265 million. The company raised its full-year 2026 guidance and returned $112 million to shareowners, including $100 million in share repurchases.

Why it matters — The results and higher full-year guidance provide SOLS watchers with an update on sales growth, profitability, and the company’s capital returns.

FAQ

Frequently asked questions about SOLS stock

What is the SOLS stock price forecast for 2026-2027?

The 10 Wall Street analysts covering Solstice Advanced Materials, Inc. have a median 12-month price target of $76, with estimates ranging from $70 to $87. These are third-party analyst estimates, not Ticker Nerd forecasts, and they are frequently wrong.

Is SOLS stock a buy right now?

Of the 10 analysts covering Solstice Advanced Materials, Inc., 9 rate it a Buy, 1 a Hold and 0 a Sell. Ticker Nerd's systematic factor model ranks Solstice Advanced Materials, Inc. 15 out of 100 across roughly 4,600 US stocks as at 13 Nov 2026. None of this is personal advice — it does not consider your circumstances.

How does Ticker Nerd's model rank SOLS?

As at 13 Nov 2026, Solstice Advanced Materials, Inc. ranks 15 out of 100 on Ticker Nerd's systematic factor model — a percentile across roughly 4,600 US stocks, built from its factor families. Its strongest factor family is Revisions (77 of 100).

Will SOLS stock go up?

No one can know that. What the data says: the median 12-month target from 10 analysts implies +14.9% from the last close, and Ticker Nerd's factor model ranks Solstice Advanced Materials, Inc. 15 out of 100 as at 13 Nov 2026. Analyst targets are third-party estimates and frequently wrong; none of this is personal advice.

What is the SOLS stock forecast for 2030?

No analyst covering Solstice Advanced Materials, Inc. publishes a 2030 price target — Wall Street targets run 12 to 18 months out. Sites quoting a 2030 price for SOLS are extrapolating price history, which says nothing about the business. The furthest attributed numbers are the current analyst targets: $70 to $87 over the next 12 months.

How has SOLS stock performed over the past year?

Solstice Advanced Materials, Inc. returned +45.1% over the 12 months to 13 Nov 2026, with dividends reinvested. Past performance does not indicate future returns.

What does Solstice Advanced Materials, Inc. do?

Solstice Advanced Materials Inc. is a specialty materials company that develops and supplies high-performance products for industrial and technology-focused markets.

What is the latest news on SOLS?

The most recent item we track (PRNewsWire, 9 Nov 2026): "Solstice Advanced Materials Reaches Key Development Milestone for Next-Generation Foam Blowing Agent". Solstice announced a key development milestone for a next-generation foam blowing agent and plans to begin sampling the developmental candidate with selected global customers in early 2027. The company said its internal evaluation indicates the candidate would not be classified as PFAS.

Company

About Solstice Advanced Materials, Inc.

Solstice Advanced Materials Inc. is a specialty materials company that develops and supplies high-performance products for industrial and technology-focused markets. Its portfolio centers on refrigerants, blowing agents, solvents, aerosol materials, semiconductor materials, protective fibers, and healthcare packaging, supporting applications in HVAC, automotive, building insulation, data centers, defense, pharmaceuticals, and construction. The company operates through two business segments: Refrigerants & Applied Solutions, which serves cooling, insulation, and packaging-related uses, and Electronic & Specialty Materials, which provides materials for semiconductors, life sciences, and other advanced industrial applications. Solstice Advanced Materials Inc. also markets products under established brands including Solstice, Genetron, Aclar, Spectra, Fluka, and Hydranal. Headquartered in Morris Plains, New Jersey, the company serves customers in the United States and internationally as a global supplier in the specialty chemicals and advanced materials market.

CEO Mr. David B. Sewell · 4,100 employees · United States · https://www.solstice.com