RPMRPMBasic Materials · Specialty Chemicals

RPM Stock Forecast: RPM International, Inc. Price Predictions for 2026-2027

Last close, 13 Nov 2026
$104
+0.59% on the day

The 16 Wall Street analysts covering RPM International, Inc. hold a median 12-month price target of $123 — +18.1% from the last close. Ticker Nerd's systematic factor model, run across ~4,600 US stocks, ranks it 67 of 100 as at 13 Nov 2026 — in the upper half.

Market cap
$13.2B
Ticker Nerd rank
67/ 100
Median analyst target
$123
Analysts covering
16
Revenue$2.2B+7.2% y/y
Operating income$314.8M
Net income$221.6M
Free cash flow$178.2M
Quarterly, 8 quarters to 31 May 2026 · latest quarter's figure shown
Total return, dividends reinvested
1W
+0.4%
1M
+6.0%
YTD
+1.8%
1Y
−2.1%
From 52W high
−12.3%
From 52W low
+13.1%
$92
$118
52-week range, adjusted closes · the dot is the last close
Ticker Nerd rank

RPM stock analysis: one number for the whole business

Consensus tells you what everyone already believes. The model scores RPM International, Inc. on its factor families — the same systematic rank behind the Ticker Nerd portfolio.

Where the model ranks itAs at 13 Nov 2026
67/ 100

Percentile across ~4,600 US stocks on Ticker Nerd’s systematic factor model. Higher is better. How the model is built and tested

Issuance
93
Quality
93
Volatility
80
Value
74
Revisions
50
Accruals
49
Growth
48
Momentum
38
Size
13

Issuance (93): The share count has been shrinking and the company is not leaning on new borrowing.

Momentum (38): The shares have been drifting down relative to others.

Size (13): Larger than most of the companies we track — more scrutinised, less often mispriced.

Built and run by Aslam Ghouse, an ex-Goldman Sachs systematic trader with 15+ years in markets.

Wall Street

RPM stock forecast 2026-2027: analyst price targets & predictions

The bullish and bearish analyst opinions on RPM, reported as data — targets and ratings, the market's view beside the model's.

Share price and the analyst range, 12 monthsAdjusted close, US dollars
$90$100$110$120$130$140$150Jan 26Apr 26Jul 26Oct 26RPMHigh $147Median $123Low $107

Price targets and ratings are third-party analyst estimates, reported here as data. They are not Ticker Nerd forecasts, and they are frequently wrong.

Data provided by Twelve Data

What Wall Street says16 analysts
14 Buy2 Hold0 Sell
Low $107Median $123High $147

The green dot is the last close — the median target sits +18.1% from it.

Recent analyst actionsNewest first

Of the 20 most recent actions, 4 moved their price target up and 8 moved it down.

DateFirmActionRatingTarget
10 Nov 2026RBC CapitalMaintainsOutperform$120 → $125
13 Oct 2026BarclaysInitiatesEqual-Weight$107
9 Oct 2026KeybancMaintainsOverweight$123 → $117
8 Oct 2026Deutsche BankMaintainsBuy$126 → $115
7 Oct 2026CitigroupMaintainsBuy$128 → $116
7 Oct 2026RBC CapitalMaintainsOutperform$128 → $120
7 Oct 2026UBSMaintainsBuy$142 → $128
5 Oct 2026Wells FargoMaintainsOverweight$135 → $130
5 Oct 2026Wells FargoMaintainsOverweight—
28 Sept 2026Morgan StanleyMaintainsEqual-Weight$117 → $114
28 Sept 2026Morgan StanleyMaintainsEqual-Weight—
11 Sept 2026KeybancInitiatesOverweight$123
11 Sept 2026KeybancInitiatesOverweight—
23 July 2026B of A SecuritiesMaintainsBuy—
23 July 2026B of A SecuritiesMaintainsBuy$129 → $130
23 July 2026BMO CapitalMaintainsOutperform$143 → $151
23 July 2026BMO CapitalMaintainsOutperform—
23 July 2026Morgan StanleyMaintainsEqual-Weight—
23 July 2026Morgan StanleyMaintainsEqual-Weight$121 → $117
23 July 2026RBC CapitalMaintainsOutperform$126 → $128

Price targets and ratings are third-party analyst estimates, reported here as data. They are not Ticker Nerd forecasts, and they are frequently wrong.

Market Radar

This page is one stock. Monday covers all of them.

RPM appears in the Radar on the weeks it earns a place.

  • Market Radar, every Monday: the week's biggest rank moves across ~4,600 US stocks, and the reason for each.
  • The AI build-out map, free: every AI company we track on one page, with the model's Top picks in all four parts.

Free. Unsubscribe any time. Privacy

The AI build-out map
PDF
  • AI cloud capacity

    MSFTAMZNGOOGLORCL

  • AI chips

    NVDAAVGOAMDMU

  • AI networking and servers

    ANETDELLLITECRDO

  • Data centre power

    VRTCEGGEVVST

Performance

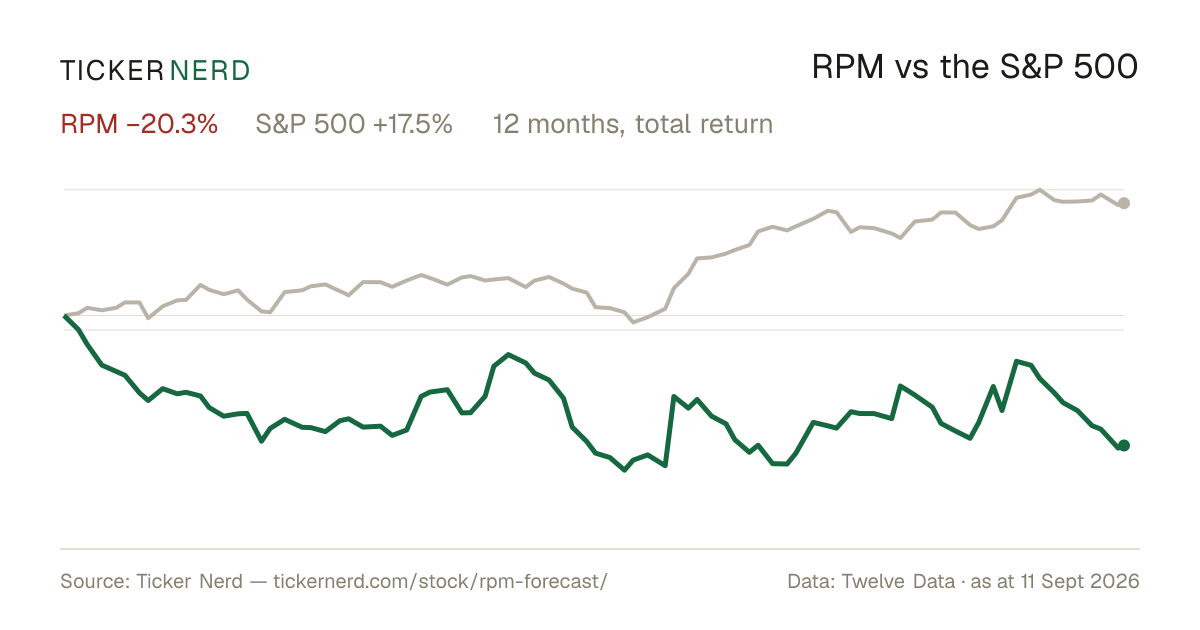
RPM vs the S&P 500

Both lines are total return — dividends reinvested — so the comparison is honest on both sides.

Over the twelve months to 13 Nov 2026, RPM International, Inc. returned −2.1% against +13.4% for the S&P 500, dividends included.

RPM vs S&P 500, last 12 monthsTotal return, rebased to 100
859095100105110115120Jan 26Apr 26Jul 26Oct 26RPMS&P 500

Download this chart as an image — free to reuse; link this page as the source.

Data provided by Twelve Data

Estimates

RPM analyst estimate revisions

Not the forecast itself — the direction analysts are revising it. Revision direction is one of the model's factor families.

Which way the estimates are movingThis fiscal year
EPS revision, 90 days
−1.7%
Analysts raising
0
Analysts cutting
11
Fundamentals

RPM International, Inc. (RPM) financial data

A margin means little on its own. Each bar marks where the figure sits across the whole US universe we score.

Valuation
Trailing P/E
19.2×

Cheaper than 38% of US stocks

Price / sales
1.7×

Cheaper than 55% of US stocks

Price / book
3.8×

Cheaper than 25% of US stocks

EV / EBITDA
12.7×

Cheaper than 29% of US stocks

Growth & margins
Revenue growth (YoY)
4.8%

Higher than 40% of US stocks

Earnings growth (YoY)
12.6%

Higher than 52% of US stocks

Gross margin
42.6%

Higher than 53% of US stocks

Operating margin
12.8%

Higher than 76% of US stocks

Net margin
8.7%

Higher than 66% of US stocks

Returns & dividend
Return on equity
21.1%

Higher than 82% of US stocks

Return on assets
7.9%

Higher than 87% of US stocks

Dividend yield
2.2%

Higher than 81% of US dividend payers

Bars mark the percentile across the ~4,600 US stocks Ticker Nerd covers, among those reporting the figure.

Key statistics

RPM International, Inc. (RPM) statistics: revenue, profit & scale

The headline figures, each with its date. Every row carries its own link — cite it straight from here.

  • RPM International, Inc. has a market value of $13.2B and an enterprise value of $15.7B.

  • Revenue in the twelve months to 31 May 2026: $7.9B. The latest quarter grew 4.8% year on year.

  • Net income over the same four quarters: $662.5M, a 8.4% net margin.

  • Diluted earnings per share, trailing twelve months: $5.16.

  • Free cash flow in the twelve months to 31 May 2026: $675.2M, after $223.5M of capital spending.

  • RPM International, Inc. spent $82.5M on share buybacks and $271.7M on dividends in the twelve months to 31 May 2026.

  • Shares outstanding: 127.6M.

  • Trailing P/E: 19.2×; forward P/E: 15.7× — the forward figure prices analyst consensus estimates, not reported earnings.

  • Forward dividend yield: 2.20%, paying out 40% of earnings.

  • RPM International, Inc. employs 17,500 people — $449K of revenue per employee.

Statement figures: company filings via Twelve Data, four quarters to 31 May 2026 · market figures as at 14 Nov 2026

Data provided by Twelve Data

Peers

RPM vs competitors

The nearest names by industry and size, scored by the same model — like for like.

Its peer group, ranked by the same modelSpecialty Chemicals
CompanyMarket capTKN rank
RPMRPM International, Inc.$13.2B67
ALBAlbemarle Corp.$11.0B76
SOLSSolstice Advanced Materials, Inc.$10.5B15
DDDuPont de Nemours, Inc.$20.8B87
IFFInternational Flavors & Fragrances, Inc.$20.8B55
LYBLyondellBasell Industries NV$20.8B80
WLKWestlake Corp.$8.2B24

Look up any of the roughly 4,600 stocks we score.

The rank is the raw material. Whether the rules would actually own RPM International, Inc. — and when they’d sell — is the membership. See the Ticker Nerd 20 →

News

Latest RPM news & analysis

RPM International: A Dividend King Trading Below Fair Value

Seeking Alpha · 13 Nov 2026positive

Seeking Alpha describes RPM International as a Dividend King with a 52-year streak, solid dividend safety metrics, and mid-single-digit dividend growth. It says RPM trades below the author’s $112.29 fair-value estimate and notes that organic growth and acquisitions support results, while construction weakness and inflation are near-term headwinds.

Why it matters — RPM watchers may weigh the dividend profile and growth drivers against the stated valuation estimate and near-term operating pressures.

RPM International Inc. (RPM) Analyst/Investor Day Transcript

Seeking Alpha · 9 Nov 2026neutral

Seeking Alpha published a transcript of RPM International Inc.’s Analyst/Investor Day.

Why it matters — RPM watchers can refer to the transcript for the company’s Analyst/Investor Day discussion; the excerpt provides no further details.

RPM International (RPM) Up 10.9% Since Last Earnings Report: Can It Continue?

Zacks Investment Research · 5 Nov 2026positive

A Zacks headline reports that RPM International shares are up 10.9% since the company’s earnings report 30 days ago, and asks whether the rise can continue.

Why it matters — The item highlights a recent share-price move since earnings, which may be relevant to RPM watchers tracking the stock’s post-report performance.

RPM to Host Investor Day on November 9

Business Wire · 2 Nov 2026neutral

RPM International announced that it will host an Investor Day on November 9.

Why it matters — RPM watchers may note the date of the company’s upcoming Investor Day.

These 4 Companies Just Increased Their Dividends. Not All the Raises Are Equal

24/7 Wall Street · 16 Oct 2026neutral

The article reports that four NYSE companies increased their dividends in one week, while noting that coverage ratios, balance sheets, and business risks vary and make some increases less secure than they may appear.

Why it matters — RPM watchers may find the article’s focus on dividend coverage and financial risks relevant when assessing dividend increases, though the excerpt does not identify RPM as one of the companies.

FAQ

Frequently asked questions about RPM stock

What is the RPM stock price forecast for 2026-2027?

The 16 Wall Street analysts covering RPM International, Inc. have a median 12-month price target of $123, with estimates ranging from $107 to $147. These are third-party analyst estimates, not Ticker Nerd forecasts, and they are frequently wrong.

Is RPM stock a buy right now?

Of the 16 analysts covering RPM International, Inc., 14 rate it a Buy, 2 a Hold and 0 a Sell. Ticker Nerd's systematic factor model ranks RPM International, Inc. 67 out of 100 across roughly 4,600 US stocks as at 13 Nov 2026. None of this is personal advice — it does not consider your circumstances.

How does Ticker Nerd's model rank RPM?

As at 13 Nov 2026, RPM International, Inc. ranks 67 out of 100 on Ticker Nerd's systematic factor model — a percentile across roughly 4,600 US stocks, built from its factor families. Its strongest factor family is Issuance (93 of 100).

Will RPM stock go up?

No one can know that. What the data says: the median 12-month target from 16 analysts implies +18.1% from the last close, and Ticker Nerd's factor model ranks RPM International, Inc. 67 out of 100 as at 13 Nov 2026. Analyst targets are third-party estimates and frequently wrong; none of this is personal advice.

What is the RPM stock forecast for 2030?

No analyst covering RPM International, Inc. publishes a 2030 price target — Wall Street targets run 12 to 18 months out. Sites quoting a 2030 price for RPM are extrapolating price history, which says nothing about the business. The furthest attributed numbers are the current analyst targets: $107 to $147 over the next 12 months.

How has RPM stock performed over the past year?

RPM International, Inc. returned -2.1% over the 12 months to 13 Nov 2026, with dividends reinvested. Past performance does not indicate future returns.

What does RPM International, Inc. do?

RPM International Inc. is a multinational specialty chemicals company focused on coatings, sealants, building materials, and related services.

What is the latest news on RPM?

The most recent item we track (Seeking Alpha, 13 Nov 2026): "RPM International: A Dividend King Trading Below Fair Value". Seeking Alpha describes RPM International as a Dividend King with a 52-year streak, solid dividend safety metrics, and mid-single-digit dividend growth. It says RPM trades below the author’s $112.29 fair-value estimate and notes that organic growth and acquisitions support results, while construction weakness and inflation are near-term headwinds.

Company

About RPM International, Inc.

RPM International Inc. is a multinational specialty chemicals company focused on coatings, sealants, building materials, and related services. RPM International Inc. serves construction, industrial, specialty, and consumer markets through a portfolio of brands and operating companies that supply products used in protection, repair, maintenance, and finishing applications. Its business spans architectural and industrial coatings, waterproofing systems, adhesives, caulks, roofing products, flooring systems, fireproofing materials, and concrete repair solutions. The company also offers consumer-oriented paints, sealants, and home improvement products under well-known brands used by contractors, professionals, and DIY customers. Organized into Construction Products Group, Performance Coatings Group, and Consumer Group, RPM International Inc. plays a broad role in the materials market by supporting infrastructure, commercial buildings, industrial facilities, and residential maintenance needs. Founded in 1947 and headquartered in Medina, Ohio, the company is known for its diversified product mix and focus on specialty applications across multiple end markets.

CEO Mr. Frank C. Sullivan · 17,500 employees · United States · https://www.rpminc.com