SPCXSPCXIndustrials · Aerospace & Defense

SPCX Stock Forecast: Space Exploration Technologies Corp. Price Predictions for 2026-2027

Last close, 4 Nov 2026
$136
−3.81% on the day

The 39 Wall Street analysts covering Space Exploration Technologies Corp. hold a median 12-month price target of $248 — +82.1% from the last close. Ticker Nerd's systematic factor model, run across ~4,600 US stocks, ranks it 1 of 100 as at 3 Nov 2026 — in the weakest quartile. The Street sees upside; the factor read is a caution. That gap is the story on this page.

Market cap
$1.9T
Ticker Nerd rank
1/ 100
Median analyst target
$248
Analysts covering
39
Revenue$7.8B
Operating income−$141.0M
Net income−$541.0M
Free cash flow−$16.8B
Quarterly, 4 quarters to 30 June 2026 · latest quarter's figure shown
Total return, dividends reinvested
1W
−6.4%
1M
−14.5%
From high
−35.7%
From low
+25.5%
$108
$211
Range since 11 June 2026, adjusted closes · the dot is the last close
Ticker Nerd rank

SPCX stock analysis: one number for the whole business

Consensus tells you what everyone already believes. The model scores Space Exploration Technologies Corp. on its factor families — the same systematic rank behind the Ticker Nerd portfolio.

Where the model ranks itAs at 3 Nov 2026
1/ 100

Percentile across ~4,600 US stocks on Ticker Nerd’s systematic factor model. Higher is better. How the model is built and tested

Revisions
91
Accruals
8
Momentum
6
Issuance
3
Value
2
Quality
0
Volatility
0
Growth
0
Size
0

Revisions (91): Analysts have, on balance, been raising their forecasts.

Growth (0): Sales and profits are flat, shrinking, or growing more slowly than they were.

Size (0): Larger than most of the companies we track — more scrutinised, less often mispriced.

Built and run by Aslam Ghouse, an ex-Goldman Sachs systematic trader with 15+ years in markets.

Wall Street

SPCX stock forecast 2026-2027: analyst price targets & predictions

The bullish and bearish analyst opinions on SPCX, reported as data — targets and ratings, the market's view beside the model's.

Share price and the analyst range, since 11 June 2026Adjusted close, US dollars
$0$200$400$600$800Jul 26Aug 26Sep 26Oct 26Nov 26SPCXHigh $800Median $248Low $70

Price targets and ratings are third-party analyst estimates, reported here as data. They are not Ticker Nerd forecasts, and they are frequently wrong.

Data provided by Twelve Data

What Wall Street says39 analysts
31 Buy6 Hold2 Sell
Low $70Median $248High $800

The green dot is the last close — the median target sits +82.1% from it.

Recent analyst actionsNewest first

Of the 20 most recent actions, 12 moved their price target up and 0 moved it down.

DateFirmActionRatingTarget
22 Oct 2026B of A SecuritiesMaintainsBuy$235 → $275
22 Oct 2026Pivotal ResearchMaintainsBuy$230 → $260
21 Oct 2026BarclaysMaintainsOverweight$254 → $300
21 Oct 2026Cantor FitzgeraldMaintainsOverweight$246 → $345
21 Oct 2026CitigroupMaintainsBuy$200 → $240
21 Oct 2026Evercore ISI GroupMaintainsOutperform$275 → $300
21 Oct 2026JP MorganMaintainsOverweight$240 → $500
21 Oct 2026KeybancReiteratesSector Weight—
21 Oct 2026MacquarieMaintainsOutperform$250
21 Oct 2026NeedhamReiteratesBuy$250
21 Oct 2026SusquehannaMaintainsNeutral$173 → $176
21 Oct 2026TD CowenMaintainsBuy$200 → $224
21 Oct 2026UBSMaintainsBuy$210 → $230
21 Oct 2026Wells FargoMaintainsOverweight$214 → $274
20 Oct 2026MacquarieMaintainsOutperform—
16 Oct 2026Evercore ISI GroupMaintainsOutperform$230 → $275
9 Oct 2026BarclaysInitiatesOverweight$254
9 Oct 2026BarclaysInitiatesOverweight—
9 Oct 2026TD CowenReiteratesBuy$200
9 Oct 2026TD CowenReiteratesBuy—

Price targets and ratings are third-party analyst estimates, reported here as data. They are not Ticker Nerd forecasts, and they are frequently wrong.

Market Radar

This page is one stock. Monday covers all of them.

SPCX appears in the Radar on the weeks it earns a place.

  • Market Radar, every Monday: the week's biggest rank moves across ~4,600 US stocks, and the reason for each.
  • The AI build-out map, free: every AI company we track, part by part, and one part in full with each verdict.

Free. Unsubscribe any time.

The AI build-out map
PDF
  • AI cloud capacity

    MSFTAMZNGOOGLORCL

  • AI chips

    NVDAAVGOAMDMU

  • AI networking and serversIn full

    ANETDELLLITECRDO

  • Data centre power

    VRTCEGGEVVST

Performance

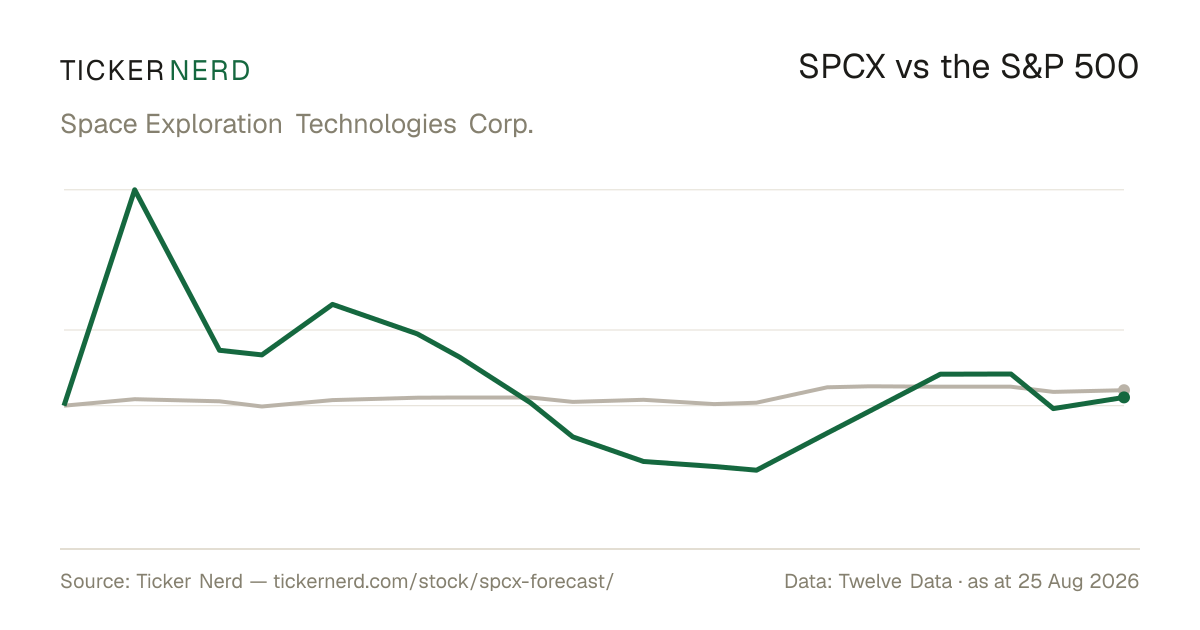
SPCX vs the S&P 500

Both lines are total return — dividends reinvested — so the comparison is honest on both sides.

SPCX vs S&P 500, last 12 monthsTotal return, rebased to 100
8090100110120130140Jul 26Aug 26Sep 26Oct 26Nov 26SPCXS&P 500

Download this chart as an image — free to reuse; link this page as the source.

Data provided by Twelve Data

Estimates

SPCX analyst estimate revisions

Not the forecast itself — the direction analysts are revising it. Revision direction is one of the model's factor families.

Which way the estimates are movingThis fiscal year
Analysts raising
2
Analysts cutting
1
Fundamentals

Space Exploration Technologies Corp. (SPCX) financial data

A margin means little on its own. Each bar marks where the figure sits across the whole US universe we score.

Valuation
Trailing P/E
588.8×

Cheaper than 1% of US stocks

Price / sales
59.9×

Cheaper than 5% of US stocks

Price / book
10.9×

Cheaper than 8% of US stocks

EV / EBITDA
159.2×

Cheaper than 1% of US stocks

Growth & margins
Revenue growth (YoY)
161.4%

Higher than 95% of US stocks

Earnings growth (YoY)
—
Gross margin
55.3%

Higher than 68% of US stocks

Operating margin
27.6%

Higher than 85% of US stocks

Net margin
−8.6%

Higher than 21% of US stocks

Returns & dividend
Return on equity
−11.9%

Higher than 35% of US stocks

Return on assets
−5.4%

Higher than 32% of US stocks

Dividend yield
0.0%

Higher than 1% of US dividend payers

Bars mark the percentile across the ~4,600 US stocks Ticker Nerd covers, among those reporting the figure.

Key statistics

Space Exploration Technologies Corp. (SPCX) statistics: revenue, profit & scale

The headline figures, each with its date. Every row carries its own link — cite it straight from here.

  • Space Exploration Technologies Corp. has a market value of $1.9T and an enterprise value of $1.9T.

  • Revenue in the twelve months to 30 June 2026: $20.6B. The latest quarter grew 161.4% year on year.

  • Net income over the same four quarters: −$6.4B, a −30.8% net margin.

  • Diluted earnings per share, trailing twelve months: $−0.89.

  • Free cash flow in the twelve months to 30 June 2026: −$32.5B, after $42.0M of capital spending.

  • Space Exploration Technologies Corp. spent $4.9B on share buybacks in the twelve months to 30 June 2026.

  • Shares outstanding: 13.2B.

  • Trailing P/E: 588.8×; forward P/E: 55.1× — the forward figure prices analyst consensus estimates, not reported earnings.

  • Forward dividend yield: 0.00%, paying out 0% of earnings.

  • Space Exploration Technologies Corp. employs 21,000 people — $983K of revenue per employee.

Statement figures: company filings via Twelve Data, four quarters to 30 June 2026 · market figures as at 4 Nov 2026

Data provided by Twelve Data

Peers

SPCX vs competitors

The nearest names by industry and size, scored by the same model — like for like.

Its peer group, ranked by the same modelAerospace & Defense
CompanyMarket capTKN rank
SPCXSpace Exploration Technologies Corp.$1.9T1
GEGE Aerospace$332.7B91
RTXRTX Corp.$273.6B95
LMTLockheed Martin Corp.$147.5B96
BAThe Boeing Co.$137.3B39
GDGeneral Dynamics Corp.$101.3B94
HWMHowmet Aerospace, Inc.$89.4B76

Look up any of the roughly 4,600 stocks we score.

The rank is the raw material. Whether the rules would actually own Space Exploration Technologies Corp. — and when they’d sell — is the membership. See the Ticker Nerd 20 →

News

Latest SPCX news & analysis

How Much Is SpaceX's AI Business Really Worth? Here's the Math.

The Motley Fool · 4 Nov 2026positive

The Motley Fool article examines the potential value of SpaceX’s AI business, pointing to expected growth tied in part to its data center infrastructure build-out.

Why it matters — The AI business and its infrastructure plans may be relevant to SPCX watchers assessing SpaceX’s growth prospects.

How a blue wave crushed the tech right

Business Insider · 4 Nov 2026negative

The Business Insider headline says a “blue wave” crushed the tech right. Its excerpt reports that Elon Musk spent $446 million on the midterm elections and ended up among the biggest losers.

Why it matters — The item concerns Musk’s political spending and outcome, which may be of interest to watchers of SPCX.

Bull v. Bear: QCOM Historic SPCX Deal Sets Sky-High Bar Beyond Mobile

Schwab Network · 4 Nov 2026positive

Qualcomm agreed to provide network technology for Starlink, according to the excerpt. The agreement was announced early Wednesday morning.

Why it matters — SPCX watchers may note the reported agreement as a technology arrangement involving SpaceX’s Starlink.

Why SpaceX Stock Is Down Today

The Motley Fool · 4 Nov 2026negative

The article reports that SpaceX stock is down after Democrats swept the midterm elections. It says Elon Musk spent heavily trying to help Republican candidates, many of whom lost to Democratic challengers.

Why it matters — The item links SpaceX stock’s decline to the election outcome and Musk’s political spending.

SpaceX Ups Challenge to US Mobile Carriers With Qualcomm Deal

Bloomberg Technology · 4 Nov 2026neutral

SpaceX signed a deal to obtain hardware from Qualcomm for its planned U.S. terrestrial wireless network. The agreement is the latest indication of the company's effort to challenge major U.S. mobile carriers.

Why it matters — The deal gives SPCX watchers an update on the hardware partnership behind SpaceX's planned wireless network and its ambitions in the U.S. mobile market.

FAQ

Frequently asked questions about SPCX stock

What is the SPCX stock price forecast for 2026-2027?

The 39 Wall Street analysts covering Space Exploration Technologies Corp. have a median 12-month price target of $248, with estimates ranging from $70 to $800. These are third-party analyst estimates, not Ticker Nerd forecasts, and they are frequently wrong.

Is SPCX stock a buy right now?

Of the 39 analysts covering Space Exploration Technologies Corp., 31 rate it a Buy, 6 a Hold and 2 a Sell. Ticker Nerd's systematic factor model ranks Space Exploration Technologies Corp. 1 out of 100 across roughly 4,600 US stocks as at 3 Nov 2026. None of this is personal advice — it does not consider your circumstances.

How does Ticker Nerd's model rank SPCX?

As at 3 Nov 2026, Space Exploration Technologies Corp. ranks 1 out of 100 on Ticker Nerd's systematic factor model — a percentile across roughly 4,600 US stocks, built from its factor families. Its strongest factor family is Revisions (91 of 100).

Will SPCX stock go up?

No one can know that. What the data says: the median 12-month target from 39 analysts implies +82.1% from the last close, and Ticker Nerd's factor model ranks Space Exploration Technologies Corp. 1 out of 100 as at 3 Nov 2026. Analyst targets are third-party estimates and frequently wrong; none of this is personal advice.

What is the SPCX stock forecast for 2030?

No analyst covering Space Exploration Technologies Corp. publishes a 2030 price target — Wall Street targets run 12 to 18 months out. Sites quoting a 2030 price for SPCX are extrapolating price history, which says nothing about the business. The furthest attributed numbers are the current analyst targets: $70 to $800 over the next 12 months.

What does Space Exploration Technologies Corp. do?

Space Exploration Technologies Corp. Class A Common Stock represents ownership in Space Exploration Technologies Corp., commonly known as SpaceX, a space technology, connectivity, and artificial intelligence company headquartered in Starbase, Texas.

What is the latest news on SPCX?

The most recent item we track (The Motley Fool, 4 Nov 2026): "How Much Is SpaceX's AI Business Really Worth? Here's the Math.". The Motley Fool article examines the potential value of SpaceX’s AI business, pointing to expected growth tied in part to its data center infrastructure build-out.

Company

About Space Exploration Technologies Corp.

Space Exploration Technologies Corp. Class A Common Stock represents ownership in Space Exploration Technologies Corp., commonly known as SpaceX, a space technology, connectivity, and artificial intelligence company headquartered in Starbase, Texas. The company designs, manufactures, and operates reusable rockets, spacecraft, and launch systems for commercial, government, and institutional customers, supporting missions that place payloads into orbit and enable broader access to space. Its Connectivity segment operates satellite-based broadband and communications services through the Starlink network, serving consumers, enterprises, and government users in multiple regions. The company also maintains an AI segment that develops software, models, and computing infrastructure integrated with its broader technology ecosystem. Space Exploration Technologies Corp. plays a significant role in aerospace, satellite communications, and advanced AI infrastructure, making it a diversified participant in several high-technology markets.

CEO Mr. Elon R. Musk · 21,000 employees · United States · https://www.spacex.com