SPHRSPHRCommunication Services · Entertainment

SPHR Stock Forecast: Sphere Entertainment Co. Price Predictions for 2026-2027

Last close, 6 Oct 2026
$105
−4.89% on the day

The 13 Wall Street analysts covering Sphere Entertainment Co. hold a median 12-month price target of $175 — +66.1% from the last close. Ticker Nerd's systematic factor model, run across ~4,600 US stocks, ranks it 44 of 100 as at 6 Oct 2026 — in the lower half.

Market cap
$4.6B
Ticker Nerd rank
44 / 100
Median analyst target
$175
Analysts covering
13
Revenue$313.6M+11.0% y/y
Operating income−$60.9M
Net income−$38.3M
Free cash flow−$48.1M
Quarterly, 8 quarters to 30 June 2026 · latest quarter's figure shown
Total return, dividends reinvested
1W
−21.5%
1M
−26.0%
YTD
+10.8%
1Y
+66.1%
From 52W high
−40.3%
From 52W low
+79.5%
$59
$176
52-week range, adjusted closes · the dot is the last close
Ticker Nerd rank

SPHR stock analysis: one number for the whole business

Consensus tells you what everyone already believes. The model scores Sphere Entertainment Co. on its factor families — the same systematic rank behind the Ticker Nerd portfolio.

Where the model ranks itAs at 6 Oct 2026
44 / 100

Percentile across ~4,600 US stocks on Ticker Nerd’s systematic factor model. Higher is better. How the model is built and tested

Accruals
95
Momentum
84
Issuance
72
Revisions
52
Value
47
Quality
32
Size
27
Volatility
25
Growth
0

Accruals (95): Reported profit is backed by cash, and the company is not expanding recklessly.

Growth (0): Sales and profits are flat, shrinking, or growing more slowly than they were.

Built and run by Aslam Ghouse, an ex-Goldman Sachs quant trader with fourteen years in markets.

Wall Street

SPHR stock forecast 2026-2027: analyst price targets & predictions

The bullish and bearish analyst opinions on SPHR, reported as data — targets and ratings, the market's view beside the model's.

Share price and the analyst range, 12 monthsAdjusted close, US dollars
$50$100$150$200Jan 26Apr 26Jul 26Oct 26SPHRHigh $208Median $175Low $158

Price targets and ratings are third-party analyst estimates, reported here as data. They are not Ticker Nerd forecasts, and they are frequently wrong.

Data provided by Twelve Data

What Wall Street says13 analysts
12 Buy1 Hold0 Sell
Low $158Median $175High $208

The green dot is the last close — the median target sits +66.1% from it.

Recent analyst actionsNewest first

Of the 20 most recent actions, 5 moved their price target up and 1 moved it down.

DateFirmActionRatingTarget
2 Sept 2026GuggenheimMaintainsBuy$193 → $208
20 Aug 2026Piper SandlerInitiatesOverweight—
20 Aug 2026Piper SandlerInitiatesOverweight$185
3 Aug 2026BTIGReiteratesBuy$190
3 Aug 2026BTIGReiteratesBuy—
31 July 2026GuggenheimMaintainsBuy$188 → $193
31 July 2026GuggenheimMaintainsBuy—
31 July 2026JP MorganMaintainsOverweight$165 → $164
31 July 2026JP MorganMaintainsOverweight—
27 July 2026BTIGReiteratesBuy—
27 July 2026BTIGReiteratesBuy$190
21 July 2026JP MorganMaintainsOverweight$150 → $165
21 July 2026JP MorganMaintainsOverweight—
14 July 2026GuggenheimMaintainsBuy$175 → $188
14 July 2026GuggenheimMaintainsBuy—
9 July 2026Goldman SachsMaintainsBuy$150 → $189
9 July 2026Goldman SachsMaintainsBuy—
18 June 2026BenchmarkMaintainsBuy—
18 June 2026SusquehannaMaintainsPositive—
17 June 2026CitizensMaintainsMarket Outperform—

Price targets and ratings are third-party analyst estimates, reported here as data. They are not Ticker Nerd forecasts, and they are frequently wrong.

Market Radar

This page is one stock. Monday covers all of them.

Computed off the Friday close and sent before the US open.

Market Radar reports the week’s largest rank changes across roughly 4,600 US stocks, the factor behind each one, and where the market went. SPHR appears on the weeks it earns a place.

Free, every Monday. Unsubscribe any time.

Performance

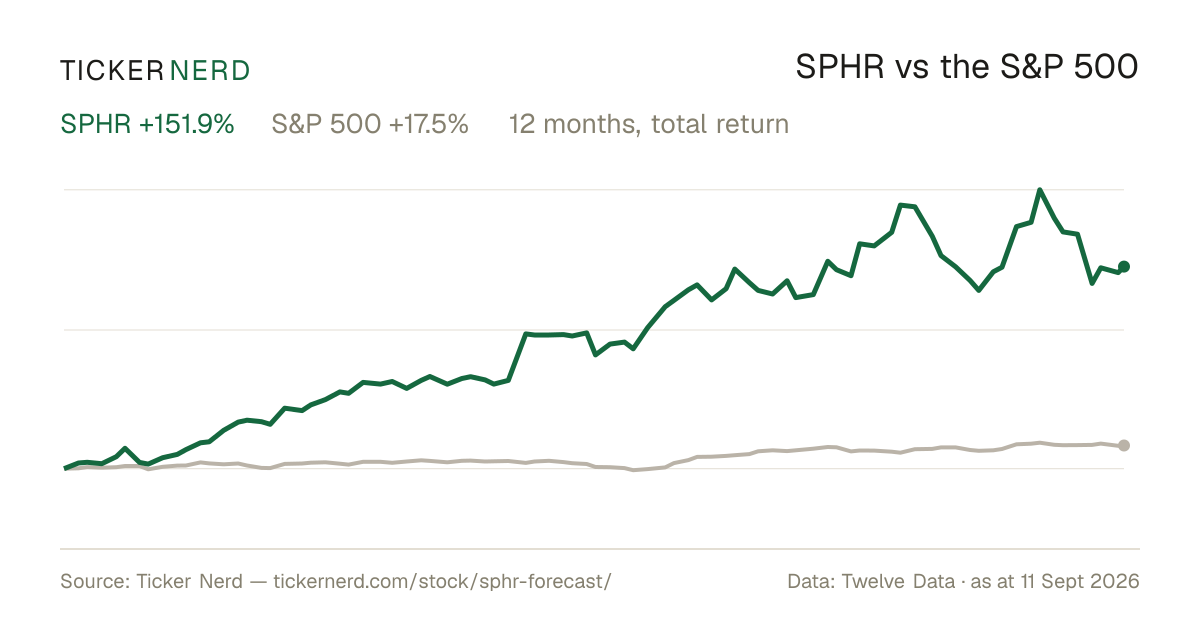
SPHR vs the S&P 500

Both lines are total return — dividends reinvested — so the comparison is honest on both sides.

Over the twelve months to 6 Oct 2026, Sphere Entertainment Co. returned +66.1% against +17.3% for the S&P 500, dividends included.

SPHR vs S&P 500, last 12 monthsTotal return, rebased to 100
100150200250Jan 26Apr 26Jul 26Oct 26SPHRS&P 500

Download this chart as an image — free to reuse; link this page as the source.

Data provided by Twelve Data

Estimates

SPHR analyst estimate revisions

Not the forecast itself — the direction analysts are revising it. Revision direction is one of the model's factor families.

Which way the estimates are movingNext fiscal year
Analysts raising
0
Analysts cutting
2
Fundamentals

Sphere Entertainment Co. (SPHR) financial data

A margin means little on its own. Each bar marks where the figure sits across the whole US universe we score.

Valuation
Trailing P/E
47.2×

Cheaper than 16% of US stocks

Price / sales
3.0×

Cheaper than 41% of US stocks

Price / book
1.8×

Cheaper than 48% of US stocks

EV / EBITDA
19.5×

Cheaper than 16% of US stocks

Growth & margins
Revenue growth (YoY)
11.0%

Higher than 55% of US stocks

Earnings growth (YoY)
11.0%

Higher than 49% of US stocks

Gross margin
51.8%

Higher than 64% of US stocks

Operating margin
−19.5%

Higher than 21% of US stocks

Net margin
−5.7%

Higher than 23% of US stocks

Returns & dividend
Return on equity
−3.1%

Higher than 41% of US stocks

Return on assets
−1.3%

Higher than 39% of US stocks

Dividend yield
0.0%

Higher than 1% of US dividend payers

Bars mark the percentile across the ~4,600 US stocks Ticker Nerd covers, among those reporting the figure.

Key statistics

Sphere Entertainment Co. (SPHR) statistics: revenue, profit & scale

The headline figures, each with its date. Every row carries its own link — cite it straight from here.

  • Sphere Entertainment Co. has a market value of $4.6B and an enterprise value of $5.0B.

  • Revenue in the twelve months to 30 June 2026: $1.4B. The latest quarter grew 11.0% year on year.

  • Net income over the same four quarters: −$70.3M, a −5.2% net margin.

  • Diluted earnings per share, trailing twelve months: $−2.68.

  • Free cash flow in the twelve months to 30 June 2026: $359.1M, after $39.6M of capital spending.

  • Shares outstanding: 35.9M.

  • Trailing P/E: 47.2×; forward P/E: −54.7× — the forward figure prices analyst consensus estimates, not reported earnings.

  • Forward dividend yield: 0.00%, paying out 0% of earnings.

  • Sphere Entertainment Co. employs 1,100 people — $1.2M of revenue per employee.

Statement figures: company filings via Twelve Data, four quarters to 30 June 2026 · market figures as at 6 Oct 2026

Data provided by Twelve Data

Peers

SPHR vs competitors

The nearest names by industry and size, scored by the same model — like for like.

Its peer group, ranked by the same modelEntertainment
CompanyMarket capTKN rank
SPHRSphere Entertainment Co.$4.6B
44
MSGEMadison Square Garden Entertainment Corp.$3.8B
99
MANUManchester United Plc$3.5B
60
CNKCinemark Holdings, Inc.$4.1B
97
BATRKAtlanta Braves Holdings, Inc.$3.4B
22
VSNTVersant Media Group, Inc.$4.5B
30
IMAXIMAX Corp.$2.8B
90

Look up any of the roughly 4,600 stocks we score.

The rank is the raw material. Whether the rules would actually own Sphere Entertainment Co. — and when they’d sell — is the membership. See the Ticker Nerd 20 →

News

Latest SPHR news & analysis

Sphere Entertainment: Don't Let The Selloff Spook You

Seeking Alpha · 6 Oct 2026positive

Seeking Alpha says Sphere Entertainment retains a robust long-term growth outlook despite a recent stock pullback and high short interest. It cites the Sphere segment’s operating income growth, demand for enhanced 4D Wizard of Oz shows, and new venues in the pipeline.

Why it matters — SPHR watchers may view the venue pipeline and Sphere segment performance as indicators of the company’s stated growth opportunity.

Why Is Sphere Entertainment Stock Sinking Monday?

Benzinga · 5 Oct 2026negative

Sphere Entertainment Co. (NYSE:SPHR) stock fell nearly 12% on Monday following a downgrade by Craig-Hallum, which also sharply cut its price forecast for the company.

Why it matters — A downgrade and sharply reduced price target from a major analyst firm could weigh on investor sentiment and expectations for Sphere Entertainment's stock.

Sphere Entertainment Stock Sinks as Analysts Say ‘Wizard of Oz' Demand Cools

Barrons · 5 Oct 2026negative

Sphere Entertainment's stock fell after analysts suggested Wall Street may be overly bullish on the company, citing cooling demand for its 'Wizard of Oz' show.

Why it matters — A watcher of Sphere Entertainment would care because analyst caution about softening demand for a flagship production could signal weaker-than-expected business performance ahead.

Sphere Debuts Enhanced and Expanded 4D Effects for The Wizard of Oz at Sphere

Business Wire · 25 Sept 2026positive

Sphere Entertainment announced the debut of enhanced and expanded 4D effects for The Wizard of Oz at Sphere, adding animatronic Winged Monkeys, themed scents, scented apples, pyrotechnic fireworks, and "Glinda Glitter." These effects build upon the experience that has been running at the Las Vegas venue since its debut on August 28, 2025.

Why it matters — SPHR watchers would care because the ongoing enhancement and expansion of a popular attraction at the Las Vegas venue reflects the company's continued investment in its flagship experience, which drives visitor engagement and venue traffic.

Sphere and Disguise Announce Multi-Year Technology Partnership to Advance the Future of Immersive Live Entertainment

Business Wire · 23 Sept 2026positive

Sphere Entertainment Co. and Disguise announced a new multi-year partnership to develop advanced technologies custom-made for Sphere's immersive entertainment venue. Disguise, a global leader in visual technology, has served as a key technology partner for Sphere since its opening in 2023, supporting live residency productions and corporate events.

Why it matters — The extended partnership signals continued investment in specialized technology for Sphere's venue, potentially strengthening its competitive position in immersive live entertainment.

FAQ

Frequently asked questions about SPHR stock

What is the SPHR stock price forecast for 2026-2027?

The 13 Wall Street analysts covering Sphere Entertainment Co. have a median 12-month price target of $175, with estimates ranging from $158 to $208. These are third-party analyst estimates, not Ticker Nerd forecasts, and they are frequently wrong.

Is SPHR stock a buy right now?

Of the 13 analysts covering Sphere Entertainment Co., 12 rate it a Buy, 1 a Hold and 0 a Sell. Ticker Nerd's systematic factor model ranks Sphere Entertainment Co. 44 out of 100 across roughly 4,600 US stocks as at 6 Oct 2026. None of this is personal advice — it does not consider your circumstances.

How does Ticker Nerd's model rank SPHR?

As at 6 Oct 2026, Sphere Entertainment Co. ranks 44 out of 100 on Ticker Nerd's systematic factor model — a percentile across roughly 4,600 US stocks, built from its factor families. Its strongest factor family is Accruals (95 of 100).

Will SPHR stock go up?

No one can know that. What the data says: the median 12-month target from 13 analysts implies +66.1% from the last close, and Ticker Nerd's factor model ranks Sphere Entertainment Co. 44 out of 100 as at 6 Oct 2026. Analyst targets are third-party estimates and frequently wrong; none of this is personal advice.

What is the SPHR stock forecast for 2030?

No analyst covering Sphere Entertainment Co. publishes a 2030 price target — Wall Street targets run 12 to 18 months out. Sites quoting a 2030 price for SPHR are extrapolating price history, which says nothing about the business. The furthest attributed numbers are the current analyst targets: $158 to $208 over the next 12 months.

How has SPHR stock performed over the past year?

Sphere Entertainment Co. returned +66.1% over the 12 months to 6 Oct 2026, with dividends reinvested. Past performance does not indicate future returns.

What does Sphere Entertainment Co. do?

Sphere Entertainment Co. Class A Common Stock represents equity in Sphere Entertainment Co., a live entertainment and media company based in New York.

What is the latest news on SPHR?

The most recent item we track (Seeking Alpha, 6 Oct 2026): "Sphere Entertainment: Don't Let The Selloff Spook You". Seeking Alpha says Sphere Entertainment retains a robust long-term growth outlook despite a recent stock pullback and high short interest. It cites the Sphere segment’s operating income growth, demand for enhanced 4D Wizard of Oz shows, and new venues in the pipeline.

Company

About Sphere Entertainment Co.

Sphere Entertainment Co. Class A Common Stock represents equity in Sphere Entertainment Co., a live entertainment and media company based in New York. The company operates through two main segments: Sphere, which delivers immersive entertainment experiences using advanced audiovisual technologies, and MSG Networks, which provides regional sports and entertainment networks along with direct-to-consumer and authenticated streaming products. Its business is centered on large-scale venue experiences, live programming, sports content, advertising, sponsorships, and related media distribution. Sphere Entertainment Co. serves audiences and partners across entertainment, sports, and digital media markets, making it a notable participant in premium live content and venue-based entertainment.

CEO Mr. James Lawrence Dolan · 1,100 employees · United States · https://www.sphereentertainmentco.com