TFXTFXHealthcare · Medical Instruments & Supplies

TFX Stock Forecast: Teleflex, Inc. Price Predictions for 2026-2027

Last close, 14 Aug 2026
$137
−0.15% on the day

The 13 Wall Street analysts covering Teleflex, Inc. hold a median 12-month price target of $155 — +13.0% from the last close. Ticker Nerd's systematic factor model, run across ~4,600 US stocks, ranks it 82 of 100 as at 15 Aug 2026 — inside the top quartile. Here, the model and the Street point the same way.

Market cap
$6.1B
Ticker Nerd rank
82 / 100
Median analyst target
$155
Analysts covering
13
Total return, dividends reinvested
1W
+1.6%
1M
+5.4%
YTD
+13.0%
1Y
+14.2%
From 52W high
−2.1%
From 52W low
+37.5%
$100
$140
52-week range, adjusted closes · the dot is the last close
Ticker Nerd rank

TFX stock analysis: one number for the whole business

Consensus tells you what everyone already believes. The model scores Teleflex, Inc. on its factor families — the same systematic rank behind the Ticker Nerd portfolio.

Where the model ranks itAs at 15 Aug 2026
82 / 100

Percentile across ~4,600 US stocks on Ticker Nerd’s systematic factor model. Higher is better. How the model is built and tested

Accruals
96
Value
94
Revisions
89
Volatility
78
Momentum
69
Issuance
51
Quality
46
Growth
27
Size
22

Accruals (96): Reported profit is backed by cash, and the company is not expanding recklessly.

Growth (27): Sales and profits are flat, shrinking, or growing more slowly than they were.

Size (22): Larger than most of the companies we track — more scrutinised, less often mispriced.

Built and run by Aslam Ghouse, an ex-Goldman Sachs quant trader with fourteen years in markets.

Wall Street

TFX stock forecast 2026-2027: analyst price targets & predictions

The bullish and bearish analyst opinions on TFX, reported as data — targets and ratings, the market's view beside the model's.

Share price and the analyst range, 12 monthsAdjusted close, US dollars
$100$120$140$160$180Oct 25Jan 26Apr 26Jul 26TFXHigh $169Median $155Low $138

Price targets and ratings are third-party analyst estimates, reported here as data. They are not Ticker Nerd forecasts, and they are frequently wrong.

What Wall Street says13 analysts
5 Buy8 Hold0 Sell
Low $138Median $155High $169

The green dot is the last close — the median target sits +13.0% from it.

Recent analyst actionsNewest first

Of the 20 most recent actions, 5 moved their price target up and 0 moved it down.

DateFirmActionRatingTarget
11 Aug 2026UBSMaintainsNeutral$145$158
10 Aug 2026Truist SecuritiesMaintainsHold$143$150
7 Aug 2026Piper SandlerReiteratesOverweight$160$169
31 July 2026NeedhamMaintainsBuy$147$159
31 July 2026NeedhamMaintainsBuy
28 July 2026UBSInitiatesNeutral$145
28 July 2026UBSInitiatesNeutral
15 July 2026MizuhoMaintainsNeutral$140$145
15 July 2026MizuhoMaintainsNeutral
9 July 2026BMO CapitalInitiatesOutperform$159
9 July 2026BMO CapitalInitiatesOutperform
8 June 2026Piper SandlerUpgradeOverweight
11 May 2026Truist SecuritiesReiteratesHold
8 May 2026RBC CapitalUpgradeOutperform
8 May 2026Wells FargoMaintainsEqual-Weight
27 Mar 2026Raymond JamesUpgradeOutperform
27 Feb 2026RBC CapitalMaintainsSector Perform
27 Feb 2026Wells FargoMaintainsEqual-Weight
26 Feb 2026NeedhamMaintainsBuy
29 Jan 2026Wells FargoMaintainsEqual-Weight

Price targets and ratings are third-party analyst estimates, reported here as data. They are not Ticker Nerd forecasts, and they are frequently wrong.

Market Radar

This page is one stock. Monday covers all of them.

Computed off the Friday close and sent before the US open.

Market Radar reports the week’s largest rank changes across roughly 4,600 US stocks, the factor behind each one, and where the market went. TFX appears on the weeks it earns a place.

Free, every Monday. Unsubscribe any time.

Estimates

TFX analyst estimate revisions

Not the forecast itself — the direction analysts are revising it. Revision direction is one of the model's factor families.

Which way the estimates are movingNext fiscal year
EPS revision, 90 days
+7.7%
Analysts raising
1
Analysts cutting
0
Fundamentals

Teleflex, Inc. (TFX) financial data

A margin means little on its own. Each bar marks where the figure sits across the whole US universe we score.

Valuation
Trailing P/E
2735.6×

Cheaper than 1% of US stocks

Price / sales
2.6×

Cheaper than 46% of US stocks

Price / book
2.0×

Cheaper than 47% of US stocks

EV / EBITDA
20.9×

Cheaper than 16% of US stocks

Growth & margins
Revenue growth (YoY)
28.9%

Higher than 78% of US stocks

Earnings growth (YoY)
−18.7%

Higher than 20% of US stocks

Gross margin
58.2%

Higher than 72% of US stocks

Operating margin
14.4%

Higher than 72% of US stocks

Net margin
−45.8%

Higher than 11% of US stocks

Returns & dividend
Return on equity
−0.7%

Higher than 43% of US stocks

Return on assets
1.7%

Higher than 57% of US stocks

Dividend yield
1.0%

Higher than 23% of US dividend payers

Bars mark the percentile across the ~4,600 US stocks Ticker Nerd covers, among those reporting the figure.

Peers

TFX vs competitors

The nearest names by industry and size, scored by the same model — like for like.

Its peer group, ranked by the same modelMedical Instruments & Supplies
CompanyMarket capTKN rank
TFXTeleflex, Inc.$6.1B
82
BLCOBausch + Lomb Corp.$6.1B
86
STVNStevanato Group SpA$5.7B
64
MMEDMiniMed Group, Inc.$5.7B
2
MMSIMerit Medical Systems, Inc.$5.4B
90
NVSTEnvista Holdings Corp.$4.7B
99
ICUIICU Medical, Inc.$4.5B
96

Look up any of the roughly 4,600 stocks we score.

The rank is the raw material. Whether the rules would actually own Teleflex, Inc. — and when they’d sell — is the membership. See the Ticker Nerd 20 →

News

Latest TFX news & analysis

TFX vs. PEN: Which Stock Is the Better Value Option?

Zacks Investment Research · 10 Aug 2026neutral

Zacks Investment Research published a comparison of Teleflex (TFX) and Penumbra (PEN), two Medical - Instruments stocks, asking which presents investors with the better value opportunity. The piece frames the two companies as familiar options for investors in that sector.

Why it matters — This comparison is relevant for TFX watchers because it evaluates Teleflex's value positioning relative to a direct peer in the medical instruments space.

Why Teleflex (TFX) International Revenue Trends Deserve Your Attention

Zacks Investment Research · 10 Aug 2026neutral

Zacks Investment Research published an article highlighting Teleflex's (TFX) reliance on international revenue. The piece encourages evaluating this factor to better understand the company's financial stability, growth prospects, and potential stock price performance.

Why it matters — A TFX watcher would care because international revenue is a key factor for assessing the company's financial health, growth potential, and how its stock may perform.

Teleflex Q2 Earnings Call Highlights

MarketBeat · 9 Aug 2026positive

Teleflex reported second-quarter revenue and adjusted earnings above its expectations, supported by strong growth in its Vascular and Surgical businesses. Slower-than-anticipated integration of its acquired Vascular Intervention business weighed on Interventional results.

Why it matters — A TFX watcher would care because the results show strength in core business lines while pointing to integration challenges in a recent acquisition that could influence future performance.

Teleflex Incorporated (TFX) Q2 2026 Earnings Call Transcript

Seeking Alpha · 6 Aug 2026neutral

Seeking Alpha published the transcript of Teleflex Incorporated's (TFX) Q2 2026 earnings call. The document contains the full discussion from the company's quarterly earnings presentation.

Why it matters — A TFX watcher would care because the transcript gives direct access to management's commentary on the company's second-quarter results.

Teleflex (TFX) Reports Q2 Earnings: What Key Metrics Have to Say

Zacks Investment Research · 6 Aug 2026neutral

Teleflex reported its earnings for the quarter ended June 2026, and coverage highlights how its key metrics compare with Wall Street estimates and year-ago figures. The report focuses on what those metrics show about the company's performance in the period.

Why it matters — TFX watchers can gauge whether the company met analyst expectations in the latest quarter and how its underlying business metrics trended versus the prior-year period.

FAQ

Frequently asked questions about TFX stock

What is the TFX stock price forecast for 2026-2027?

The 13 Wall Street analysts covering Teleflex, Inc. have a median 12-month price target of $155, with estimates ranging from $138 to $169. These are third-party analyst estimates, not Ticker Nerd forecasts, and they are frequently wrong.

Is TFX stock a buy right now?

Of the 13 analysts covering Teleflex, Inc., 5 rate it a Buy, 8 a Hold and 0 a Sell. Ticker Nerd's systematic factor model ranks Teleflex, Inc. 82 out of 100 across roughly 4,600 US stocks as at 15 Aug 2026. None of this is personal advice — it does not consider your circumstances.

How does Ticker Nerd's model rank TFX?

As at 15 Aug 2026, Teleflex, Inc. ranks 82 out of 100 on Ticker Nerd's systematic factor model — a percentile across roughly 4,600 US stocks, built from its factor families. Its strongest factor family is Accruals (96 of 100).

Will TFX stock go up?

No one can know that. What the data says: the median 12-month target from 13 analysts implies +13.0% from the last close, and Ticker Nerd's factor model ranks Teleflex, Inc. 82 out of 100 as at 15 Aug 2026. Analyst targets are third-party estimates and frequently wrong; none of this is personal advice.

What is the TFX stock forecast for 2030?

No analyst covering Teleflex, Inc. publishes a 2030 price target — Wall Street targets run 12 to 18 months out. Sites quoting a 2030 price for TFX are extrapolating price history, which says nothing about the business. The furthest attributed numbers are the current analyst targets: $138 to $169 over the next 12 months.

How has TFX stock performed over the past year?

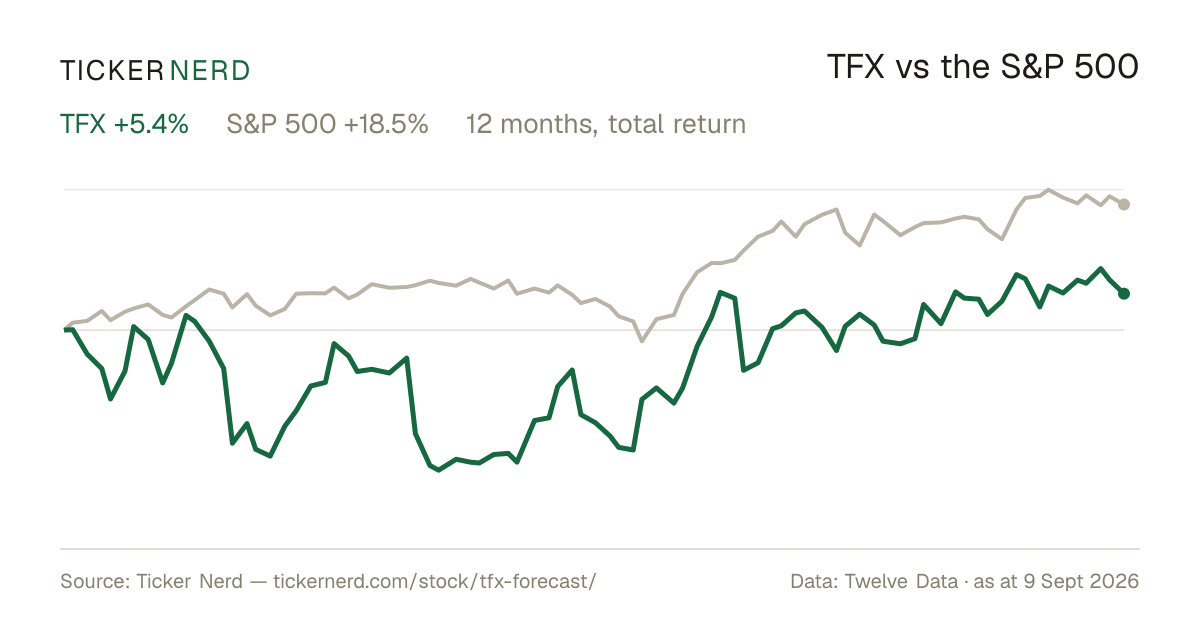
Teleflex, Inc. returned +14.2% over the 12 months to 14 Aug 2026, with dividends reinvested. Past performance does not indicate future returns.

What does Teleflex, Inc. do?

Teleflex Incorporated is a global leader in the development, manufacturing, and distribution of single-use medical devices, with its headquarters in Wayne, Pennsylvania. The company's core mission is to improve patient health and quality of life by providing innovative medical technologies designed for procedures in critical care and surgery.

What is the latest news on TFX?

The most recent item we track (Zacks Investment Research, 10 Aug 2026): "TFX vs. PEN: Which Stock Is the Better Value Option?". Zacks Investment Research published a comparison of Teleflex (TFX) and Penumbra (PEN), two Medical - Instruments stocks, asking which presents investors with the better value opportunity. The piece frames the two companies as familiar options for investors in that sector.

Company

About Teleflex, Inc.

Teleflex Incorporated is a global leader in the development, manufacturing, and distribution of single-use medical devices, with its headquarters in Wayne, Pennsylvania. The company's core mission is to improve patient health and quality of life by providing innovative medical technologies designed for procedures in critical care and surgery. Teleflex’s diverse product range serves key areas such as vascular and interventional access, anesthesia, cardiac care, surgical procedures, urology, emergency medicine, and respiratory care. Its portfolio includes well-recognized brands like Arrow, Deknatel, LMA, Pilling, QuikClot, Rüsch, UroLift System, and Weck. A significant portion of Teleflex's sales comes from interventional cardiology, radiology, urology, vascular access, and anesthesia products. With operations spanning over 40 countries and a workforce exceeding 14,000 employees, Teleflex plays a vital role in the global healthcare sector by supporting hospitals and healthcare professionals with clinically significant, high-quality solutions for complex medical needs.

CEO Mr. Jason Weidman · 15,500 employees · United States · https://www.teleflex.com