TMCRBasic Materials · Other Industrial Metals & Mining

TMCR Stock Forecast: The Metals Royalty Co., Inc. Price Predictions for 2026-2027

Last close, 3 Aug 2026
$5.40
−7.69% on the day

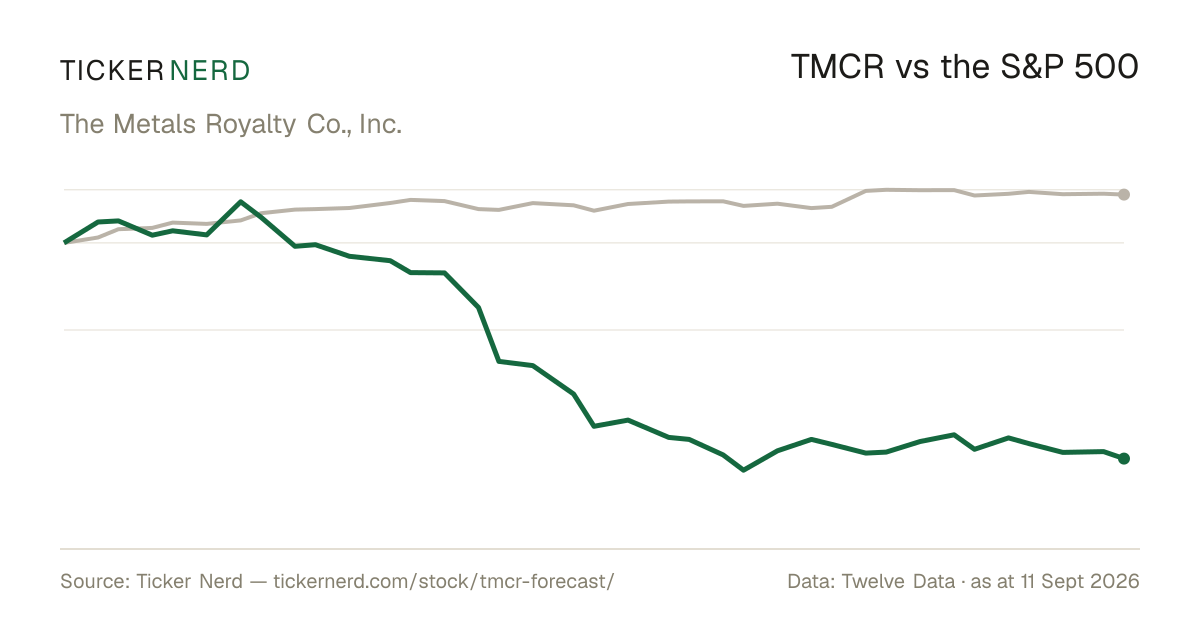
Ticker Nerd's systematic factor model, run across ~4,600 US stocks, ranks it 1 of 100 as at 1 Aug 2026 — in the weakest quartile. The Street sees upside; the factor read is a caution. That gap is the story on this page.

Market cap
$361.5M
Ticker Nerd rank
1 / 100
Median analyst target
$20
Analysts covering
0
Total return, dividends reinvested
1W
−15.5%
1M
−17.9%
From high
−65.6%
From low
+3.8%
$5
$16
Range since 8 Apr 2026, adjusted closes · the dot is the last close
Ticker Nerd rank

TMCR stock analysis: one number for the whole business

Consensus tells you what everyone already believes. The model scores The Metals Royalty Co., Inc. on its factor families — the same systematic rank behind the Ticker Nerd portfolio.

Where the model ranks itAs at 1 Aug 2026
1 / 100

Percentile across ~4,600 US stocks on Ticker Nerd’s systematic factor model. Higher is better. How the model is built and tested

Size
58
Revisions
45
Issuance
22
Accruals
8
Growth
3
Value
1
Volatility
1
Quality
0
Momentum
0

Size (58): Smaller than most of the companies we track.

Momentum (0): The shares have been drifting down relative to others.

The rank is the raw material. Whether the rules would actually own The Metals Royalty Co., Inc. — and when they’d sell — is the membership.

Wall Street

TMCR stock forecast 2026-2027: analyst price targets & predictions

The bullish and bearish analyst opinions on TMCR, reported as data — targets and ratings, the market's view beside the model's.

Share price and the analyst range, since 8 Apr 2026Adjusted close, US dollars
$5$10$15$20May 26Jun 26Jul 26Aug 26TMCRHigh $20Median $20Low $20

Price targets and ratings are third-party analyst estimates, reported here as data. They are not Ticker Nerd forecasts, and they are frequently wrong.

Price targets and ratings are third-party analyst estimates, reported here as data. They are not Ticker Nerd forecasts, and they are frequently wrong.

Estimates

TMCR analyst estimate revisions

Not the forecast itself — the direction analysts are revising it. Revision direction is one of the model's factor families.

Which way the estimates are movingNext fiscal year
Analysts raising
0
Analysts cutting
0
Fundamentals

The Metals Royalty Co., Inc. (TMCR) financial data

A margin means little on its own. Each bar marks where the figure sits across the whole US universe we score.

Valuation
Trailing P/E
690.0×

Cheaper than 1% of US stocks

Price / sales
Price / book
7.6×

Cheaper than 14% of US stocks

EV / EBITDA
−84.0×

Cheaper than 95% of US stocks

Growth & margins
Revenue growth (YoY)
Earnings growth (YoY)
Gross margin
Operating margin
0.0%

Higher than 35% of US stocks

Net margin
0.0%

Higher than 30% of US stocks

Returns & dividend
Return on equity
3.6%

Higher than 51% of US stocks

Return on assets
3.4%

Higher than 68% of US stocks

Dividend yield

Bars mark the percentile across the ~4,600 US stocks Ticker Nerd covers, among those reporting the figure.

Peers

TMCR vs competitors

The nearest names by industry and size, scored by the same model — like for like.

Its peer group, ranked by the same modelOther Industrial Metals & Mining
CompanyMarket capTKN rank
TMCRThe Metals Royalty Co., Inc.$361.5M
1
LZMLifezone Metals Ltd.$304.8M
4
TMQTrilogy Metals, Inc.$538.8M
36
GSMFerroglobe PLC$593.5M
29
ALOYRealloys, Inc.$599.1M
20
REARare Earths Americas, Inc.$198.2M
1
SBMTSilver Bow Mining Corp.$191.6M
5
Market Radar

This page is one stock. Monday covers all of them.

Computed off the Friday close and sent before the US open.

Market Radar reports the week’s largest rank changes across roughly 4,600 US stocks, the factor behind each one, and where the market went. TMCR appears on the weeks it earns a place.

Free, every Monday. Unsubscribe any time.

FAQ

Frequently asked questions about TMCR stock

How does Ticker Nerd's model rank TMCR?

As at 1 Aug 2026, The Metals Royalty Co., Inc. ranks 1 out of 100 on Ticker Nerd's systematic factor model — a percentile across roughly 4,600 US stocks, built from its factor families. Its strongest factor family is Size (58 of 100).

What is the TMCR stock forecast for 2030?

No analyst covering The Metals Royalty Co., Inc. publishes a 2030 price target — Wall Street targets run 12 to 18 months out. Sites quoting a 2030 price for TMCR are extrapolating price history, which says nothing about the business. The furthest attributed numbers are the current analyst targets: $20 to $20 over the next 12 months.

What does The Metals Royalty Co., Inc. do?

The Metals Royalty Company Inc. is a royalty acquisition company specializing in critical metals and minerals.

Company

About The Metals Royalty Co., Inc.

The Metals Royalty Company Inc. is a royalty acquisition company specializing in critical metals and minerals. It acquires and manages royalties, streams, and similar interests to provide financing that supports mineral security and independence in North America, aiding growth in energy, defense, and re-industrialization sectors. The company's portfolio is anchored by a 2.0 percent gross overriding royalty on the NORI polymetallic nodule deposit in the northeastern Pacific Ocean's Clarion-Clipperton Zone, operated by The Metals Company. This royalty business model generates revenue directly tied to the asset's gross production sales, offering predictable, high-margin income without cost deductions, which suits volatile metals markets. The Metals Royalty Company Inc. focuses on the full value chain of critical minerals essential for American defense, AI infrastructure, energy systems, and industrial capacity. Incorporated in British Columbia, Canada, and founded in 2022 with headquarters in Calgary, Alberta, it operates as a purpose-built financing platform in the critical minerals sector.

CEO Mr. Brian Paes-Braga · 10 employees · Canada · https://www.themetalsroyaltyco.com