TNETTNETIndustrials · Staffing & Employment Services

TNET Stock Forecast: TriNet Group, Inc. Price Predictions for 2026-2027

Last close, 14 Aug 2026
$69
−1.94% on the day

The 7 Wall Street analysts covering TriNet Group, Inc. hold a median 12-month price target of $62 — -9.8% from the last close. Ticker Nerd's systematic factor model, run across ~4,600 US stocks, ranks it 93 of 100 as at 15 Aug 2026 — among the strongest tenth. The factors read stronger than the Street's target implies. That gap is the story on this page.

Market cap
$3.2B
Ticker Nerd rank
93 / 100
Median analyst target
$62
Analysts covering
7
Total return, dividends reinvested
1W
+0.4%
1M
+21.0%
YTD
+18.4%
1Y
+6.5%
From 52W high
−4.1%
From 52W low
+105.9%
$33
$72
52-week range, adjusted closes · the dot is the last close
Ticker Nerd rank

TNET stock analysis: one number for the whole business

Consensus tells you what everyone already believes. The model scores TriNet Group, Inc. on its factor families — the same systematic rank behind the Ticker Nerd portfolio.

Where the model ranks itAs at 15 Aug 2026
93 / 100

Percentile across ~4,600 US stocks on Ticker Nerd’s systematic factor model. Higher is better. How the model is built and tested

Issuance
98
Value
97
Accruals
80
Growth
74
Volatility
67
Revisions
64
Quality
63
Momentum
53
Size
30

Issuance (98): The share count has been shrinking and the company is not leaning on new borrowing.

Momentum (53): The shares have been drifting down relative to others.

Size (30): Larger than most of the companies we track — more scrutinised, less often mispriced.

Built and run by Aslam Ghouse, an ex-Goldman Sachs quant trader with fourteen years in markets.

Wall Street

TNET stock forecast 2026-2027: analyst price targets & predictions

The bullish and bearish analyst opinions on TNET, reported as data — targets and ratings, the market's view beside the model's.

Share price and the analyst range, 12 monthsAdjusted close, US dollars
$30$40$50$60$70$80Oct 25Jan 26Apr 26Jul 26TNETHigh $82Median $62Low $50

Price targets and ratings are third-party analyst estimates, reported here as data. They are not Ticker Nerd forecasts, and they are frequently wrong.

What Wall Street says7 analysts
2 Buy4 Hold1 Sell
Low $50Median $62High $82

The green dot is the last close — the median target sits −9.8% from it.

Recent analyst actionsNewest first

Of the 20 most recent actions, 3 moved their price target up and 0 moved it down.

DateFirmActionRatingTarget
31 July 2026JP MorganMaintainsUnderweight$45$50
22 July 2026Truist SecuritiesMaintainsHold$50$62
22 July 2026Truist SecuritiesMaintainsHold
26 June 2026TD CowenMaintainsHold$46$49
26 June 2026TD CowenMaintainsHold
5 May 2026UBSMaintainsNeutral
1 May 2026JP MorganMaintainsUnderweight
1 May 2026TD CowenMaintainsHold
13 Feb 2026StifelMaintainsBuy
8 Jan 2026TD CowenMaintainsHold
5 Dec 2025Truist SecuritiesInitiatesHold
30 Oct 2025JP MorganMaintainsUnderweight
30 Oct 2025UBSMaintainsNeutral
28 July 2025JP MorganMaintainsUnderweight
28 Apr 2025JP MorganMaintainsUnderweight
13 Mar 2025NeedhamReiteratesHold
14 Feb 2025NeedhamReiteratesHold
20 Nov 2024TD CowenMaintainsBuy
28 Oct 2024NeedhamDowngradeHold
28 Oct 2024TD CowenMaintainsBuy

Price targets and ratings are third-party analyst estimates, reported here as data. They are not Ticker Nerd forecasts, and they are frequently wrong.

Market Radar

This page is one stock. Monday covers all of them.

Computed off the Friday close and sent before the US open.

Market Radar reports the week’s largest rank changes across roughly 4,600 US stocks, the factor behind each one, and where the market went. TNET appears on the weeks it earns a place.

Free, every Monday. Unsubscribe any time.

Estimates

TNET analyst estimate revisions

Not the forecast itself — the direction analysts are revising it. Revision direction is one of the model's factor families.

Which way the estimates are movingNext fiscal year
EPS revision, 90 days
+7.2%
Analysts raising
1
Analysts cutting
0
Fundamentals

TriNet Group, Inc. (TNET) financial data

A margin means little on its own. Each bar marks where the figure sits across the whole US universe we score.

Valuation
Trailing P/E
18.2×

Cheaper than 42% of US stocks

Price / sales
0.7×

Cheaper than 79% of US stocks

Price / book
38.2×

Cheaper than 3% of US stocks

EV / EBITDA
13.0×

Cheaper than 29% of US stocks

Growth & margins
Revenue growth (YoY)
−4.4%

Higher than 21% of US stocks

Earnings growth (YoY)
43.2%

Higher than 73% of US stocks

Gross margin
20.9%

Higher than 22% of US stocks

Operating margin
6.4%

Higher than 58% of US stocks

Net margin
3.6%

Higher than 56% of US stocks

Returns & dividend
Return on equity
150.9%

Higher than 97% of US stocks

Return on assets
4.7%

Higher than 75% of US stocks

Dividend yield
1.7%

Higher than 40% of US dividend payers

Bars mark the percentile across the ~4,600 US stocks Ticker Nerd covers, among those reporting the figure.

Peers

TNET vs competitors

The nearest names by industry and size, scored by the same model — like for like.

Its peer group, ranked by the same modelStaffing & Employment Services
CompanyMarket capTKN rank
TNETTriNet Group, Inc.$3.2B
93
MANManpowerGroup, Inc.$2.7B
91
RHIRobert Half, Inc.$4.4B
66
KFYKorn Ferry$4.4B
93
NSPInsperity, Inc.$2.0B
67
KFRCKforce, Inc.$1.1B
85
BBSIBarrett Business Services, Inc.$791.8M
57

Look up any of the roughly 4,600 stocks we score.

The rank is the raw material. Whether the rules would actually own TriNet Group, Inc. — and when they’d sell — is the membership. See the Ticker Nerd 20 →

News

Latest TNET news & analysis

TriNet: I Think The Market Is Still Too Pessimistic

Seeking Alpha · 3 Aug 2026positive

Seeking Alpha analyst assigns TriNet Group a Buy rating, citing improved operational execution, retention gains, AI-driven efficiencies, and a discounted valuation. Adjusted EBITDA margin reached 10.9%, free cash flow rose 18%, and insurance cost ratios improved, though some gains were one-time in nature, while revenue and worksite employee counts continue to decline with management expecting stabilization ahead.

Why it matters — A TNET watcher would care because the piece highlights improving profitability and efficiency metrics alongside persistent revenue and worksite declines, framing the company's path toward stabilization and future growth.

TriNet Group Q2 Earnings Call Highlights

MarketBeat · 1 Aug 2026positive

TriNet Group reported second-quarter results showing improved insurance performance, stronger customer retention, and continued investment in sales and service initiatives. The company raised its full-year earnings outlook in response.

Why it matters — A TNET watcher would care because improved insurance performance, stronger customer retention, and a raised full-year earnings outlook point to healthy operational momentum.

TriNet Group, Inc. (TNET) Q2 2026 Earnings Call Transcript

Seeking Alpha · 31 July 2026neutral

TriNet Group, Inc. held its Q2 2026 earnings call, the transcript of which was published by Seeking Alpha. The call covered the company's financial results and operational performance for the quarter.

Why it matters — Earnings call transcripts provide direct insight into TriNet's financial health, management commentary, and forward-looking outlook, which are key inputs for investors tracking the company.

TriNet (TNET) Q2 Earnings: How Key Metrics Compare to Wall Street Estimates

Zacks Investment Research · 30 July 2026neutral

The article discusses TriNet's Q2 2026 earnings, noting that its top- and bottom-line numbers reflect how the business performed, and examines how key metrics compared to Wall Street estimates and prior-year figures.

Why it matters — A TNET watcher would care because the comparison of key metrics to Wall Street estimates and year-ago values provides insight into the company's quarterly performance relative to expectations.

TriNet Group (TNET) Beats Q2 Earnings and Revenue Estimates

Zacks Investment Research · 30 July 2026positive

TriNet Group reported quarterly earnings of $1.55 per share, beating the Zacks Consensus Estimate of $1.01 per share and surpassing the $1.15 per share it earned a year ago.

Why it matters — The company exceeded analyst expectations for the quarter, indicating stronger-than-anticipated financial performance.

FAQ

Frequently asked questions about TNET stock

What is the TNET stock price forecast for 2026-2027?

The 7 Wall Street analysts covering TriNet Group, Inc. have a median 12-month price target of $62, with estimates ranging from $50 to $82. These are third-party analyst estimates, not Ticker Nerd forecasts, and they are frequently wrong.

Is TNET stock a buy right now?

Of the 7 analysts covering TriNet Group, Inc., 2 rate it a Buy, 4 a Hold and 1 a Sell. Ticker Nerd's systematic factor model ranks TriNet Group, Inc. 93 out of 100 across roughly 4,600 US stocks as at 15 Aug 2026. None of this is personal advice — it does not consider your circumstances.

How does Ticker Nerd's model rank TNET?

As at 15 Aug 2026, TriNet Group, Inc. ranks 93 out of 100 on Ticker Nerd's systematic factor model — a percentile across roughly 4,600 US stocks, built from its factor families. Its strongest factor family is Issuance (98 of 100).

Will TNET stock go up?

No one can know that. What the data says: the median 12-month target from 7 analysts implies -9.8% from the last close, and Ticker Nerd's factor model ranks TriNet Group, Inc. 93 out of 100 as at 15 Aug 2026. Analyst targets are third-party estimates and frequently wrong; none of this is personal advice.

What is the TNET stock forecast for 2030?

No analyst covering TriNet Group, Inc. publishes a 2030 price target — Wall Street targets run 12 to 18 months out. Sites quoting a 2030 price for TNET are extrapolating price history, which says nothing about the business. The furthest attributed numbers are the current analyst targets: $50 to $82 over the next 12 months.

How has TNET stock performed over the past year?

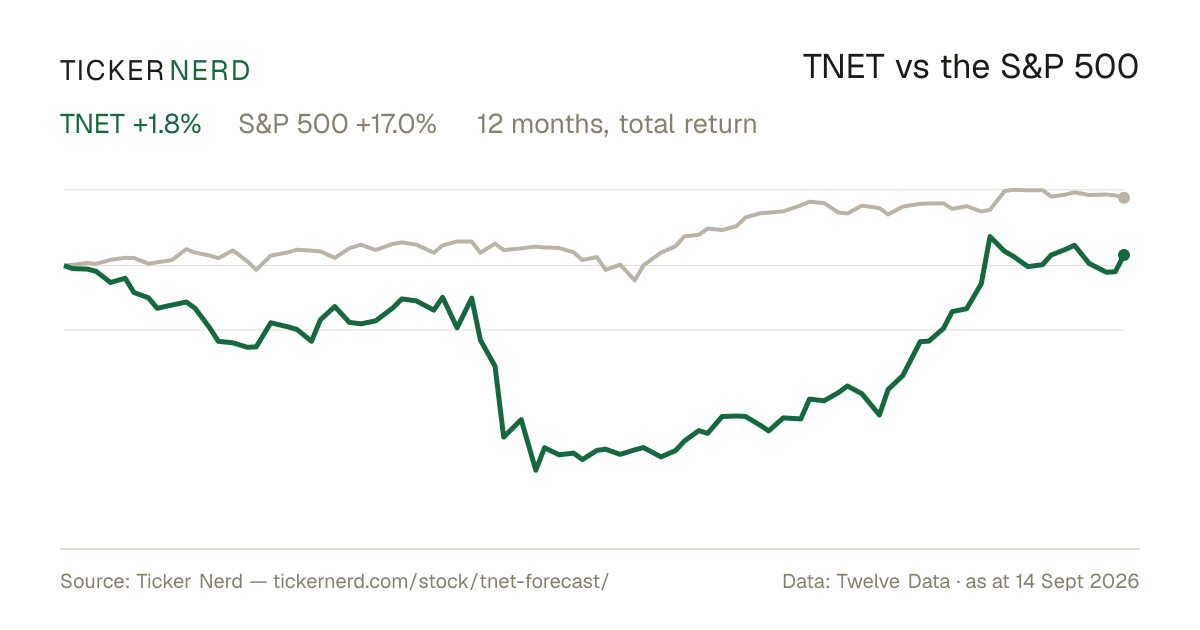
TriNet Group, Inc. returned +6.5% over the 12 months to 14 Aug 2026, with dividends reinvested. Past performance does not indicate future returns.

What does TriNet Group, Inc. do?

TriNet Group, Inc. is a professional employer organization that provides comprehensive human resources solutions to small and medium-sized businesses across the United States.

What is the latest news on TNET?

The most recent item we track (Seeking Alpha, 3 Aug 2026): "TriNet: I Think The Market Is Still Too Pessimistic". Seeking Alpha analyst assigns TriNet Group a Buy rating, citing improved operational execution, retention gains, AI-driven efficiencies, and a discounted valuation. Adjusted EBITDA margin reached 10.9%, free cash flow rose 18%, and insurance cost ratios improved, though some gains were one-time in nature, while revenue and worksite employee counts continue to decline with management expecting stabilization ahead.

Company

About TriNet Group, Inc.

TriNet Group, Inc. is a professional employer organization that provides comprehensive human resources solutions to small and medium-sized businesses across the United States. Its primary function is to enable these businesses to focus on their core missions while TriNet manages critical HR functions. These services include payroll processing, employee benefits administration, regulatory compliance, and risk management. By pooling client resources, TriNet is able to offer competitive benefits packages and streamline HR processes, tailored to various industries such as technology, life sciences, and financial services. Headquartered in Dublin, California, TriNet leverages its extensive HR expertise and industry-specific solutions to support client growth while navigating complex labor laws and employment regulations. As a key player in the human capital management sector, TriNet enhances operational efficiency for its clients, ensuring they remain compliant and competitive in a constantly evolving business environment.

CEO Mr. Michael Quinn Simonds · 302,955 employees · United States · https://www.trinet.com