VYLRVYLRFinancial Services · Shell Companies

VYLR Stock Forecast: Vylor, Inc. Price Predictions for 2026-2027

Last close, 5 Nov 2026
$69
−3.82% on the day

The 16 Wall Street analysts covering Vylor, Inc. hold a median 12-month price target of $85 — +23.3% from the last close. Ticker Nerd's systematic factor model, run across ~4,600 US stocks, ranks it 0 of 100 as at 5 Nov 2026 — in the weakest quartile. The Street sees upside; the factor read is a caution. That gap is the story on this page.

Market cap
$47.5B
Ticker Nerd rank
0/ 100
Median analyst target
$85
Analysts covering
16
Revenue$4.9B+11.0% y/y
Operating income$1.2B
Net income$723.0M
Free cash flow−$3.0B
Quarterly, 7 quarters to 31 Mar 2026 · latest quarter's figure shown
Total return, dividends reinvested
1W
−5.7%
1M
−6.5%
From high
−10.9%
From low
+1.9%
$67
$77
Range since 1 Oct 2026, adjusted closes · the dot is the last close
Ticker Nerd rank

VYLR stock analysis: one number for the whole business

Consensus tells you what everyone already believes. The model scores Vylor, Inc. on its factor families — the same systematic rank behind the Ticker Nerd portfolio.

Where the model ranks itAs at 5 Nov 2026
0/ 100

Percentile across ~4,600 US stocks on Ticker Nerd’s systematic factor model. Higher is better. How the model is built and tested

Revisions
37
Accruals
8
Momentum
6
Size
5
Issuance
4
Growth
3
Value
3
Quality
1
Volatility
0

Revisions (37): Analysts have, on balance, been raising their forecasts.

Volatility (0): The share price moves around a lot.

Built and run by Aslam Ghouse, an ex-Goldman Sachs systematic trader with 15+ years in markets.

Wall Street

VYLR stock forecast 2026-2027: analyst price targets & predictions

The bullish and bearish analyst opinions on VYLR, reported as data — targets and ratings, the market's view beside the model's.

Share price and the analyst range, since 1 Oct 2026Adjusted close, US dollars
$70$75$80$85$90Oct 26Oct 26Oct 26Oct 26Nov 26VYLRHigh $90Median $85Low $74

Price targets and ratings are third-party analyst estimates, reported here as data. They are not Ticker Nerd forecasts, and they are frequently wrong.

Data provided by Twelve Data

What Wall Street says16 analysts
11 Buy5 Hold0 Sell
Low $74Median $85High $90

The green dot is the last close — the median target sits +23.3% from it.

Recent analyst actionsNewest first
DateFirmActionRatingTarget
14 Oct 2026BNP ParibasInitiatesNeutral$75
12 Oct 2026UBSInitiatesBuy$89
8 Oct 2026Goldman SachsInitiatesBuy$87
7 Oct 2026KeybancInitiatesSector Weight—
6 Oct 2026OppenheimerInitiatesOutperform$82
6 Oct 2026OppenheimerInitiatesOutperform—
5 Oct 2026B of A SecuritiesInitiatesBuy$78
5 Oct 2026B of A SecuritiesInitiatesBuy—
5 Oct 2026MizuhoInitiatesOutperform$84
5 Oct 2026MizuhoInitiatesOutperform—
2 Oct 2026BMO CapitalInitiatesOutperform$85
2 Oct 2026BMO CapitalInitiatesOutperform—
2 Oct 2026Morgan StanleyInitiatesOverweight—
2 Oct 2026Morgan StanleyInitiatesOverweight$85
2 Oct 2026RBC CapitalInitiatesOutperform$85
2 Oct 2026RBC CapitalInitiatesOutperform—
18 Sept 2026Argus ResearchReiteratesBuy$91
17 Sept 2026CitigroupMaintainsNeutral$86 → $91
16 Sept 2026BMO CapitalMaintainsOutperform$100 → $95
16 Sept 2026RBC CapitalReiteratesOutperform$103

Price targets and ratings are third-party analyst estimates, reported here as data. They are not Ticker Nerd forecasts, and they are frequently wrong.

Market Radar

This page is one stock. Monday covers all of them.

VYLR appears in the Radar on the weeks it earns a place.

  • Market Radar, every Monday: the week's biggest rank moves across ~4,600 US stocks, and the reason for each.
  • The AI build-out map, free: every AI company we track, part by part, and one part in full with each verdict.

Free. Unsubscribe any time.

The AI build-out map
PDF
  • AI cloud capacity

    MSFTAMZNGOOGLORCL

  • AI chips

    NVDAAVGOAMDMU

  • AI networking and serversIn full

    ANETDELLLITECRDO

  • Data centre power

    VRTCEGGEVVST

Performance

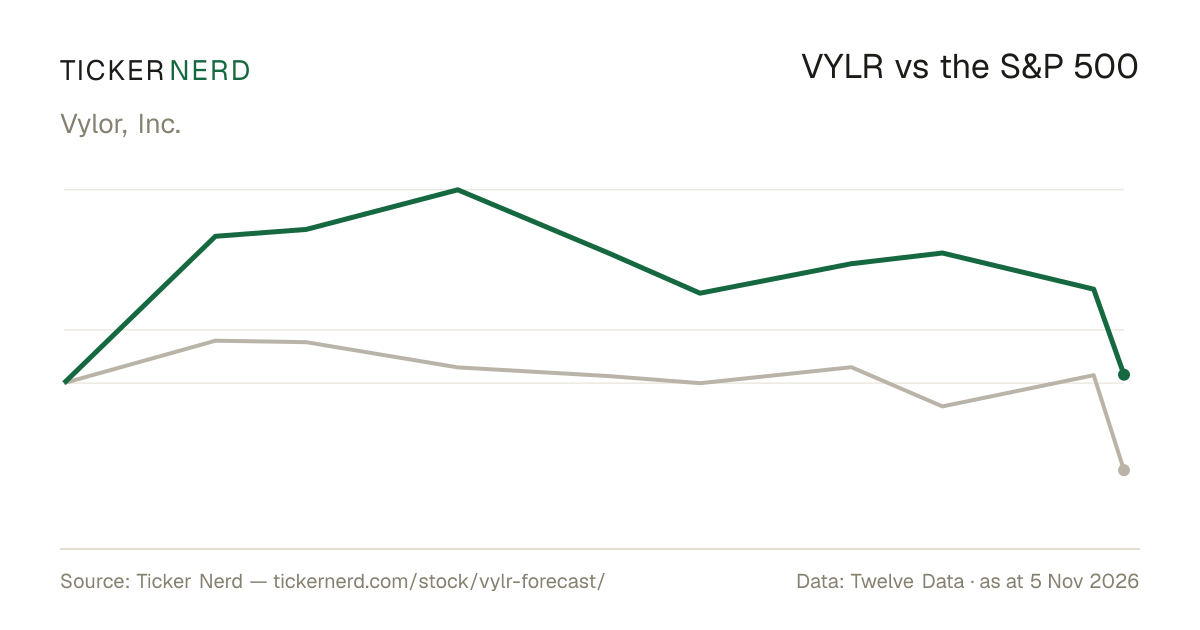
VYLR vs the S&P 500

Both lines are total return — dividends reinvested — so the comparison is honest on both sides.

VYLR vs S&P 500, last 12 monthsTotal return, rebased to 100
9698100102104106108Oct 26Oct 26Oct 26Oct 26Nov 26VYLRS&P 500

Download this chart as an image — free to reuse; link this page as the source.

Data provided by Twelve Data

Estimates

VYLR analyst estimate revisions

Not the forecast itself — the direction analysts are revising it. Revision direction is one of the model's factor families.

Which way the estimates are movingThis fiscal year
Analysts raising
0
Analysts cutting
0
Fundamentals

Vylor, Inc. (VYLR) financial data

A margin means little on its own. Each bar marks where the figure sits across the whole US universe we score.

Valuation
Trailing P/E
101.8×

Cheaper than 7% of US stocks

Price / sales
2.7×

Cheaper than 42% of US stocks

Price / book
1.9×

Cheaper than 44% of US stocks

EV / EBITDA
11.8×

Cheaper than 32% of US stocks

Growth & margins
Revenue growth (YoY)
−1.2%

Higher than 26% of US stocks

Earnings growth (YoY)
−11.6%

Higher than 26% of US stocks

Gross margin
51.6%

Higher than 64% of US stocks

Operating margin
30.1%

Higher than 87% of US stocks

Net margin
5.7%

Higher than 61% of US stocks

Returns & dividend
Return on equity
4.3%

Higher than 52% of US stocks

Return on assets
4.5%

Higher than 74% of US stocks

Dividend yield
0.7%

Higher than 68% of US dividend payers

Bars mark the percentile across the ~4,600 US stocks Ticker Nerd covers, among those reporting the figure.

Key statistics

Vylor, Inc. (VYLR) statistics: revenue, profit & scale

The headline figures, each with its date. Every row carries its own link — cite it straight from here.

  • Vylor, Inc. has a market value of $47.5B and an enterprise value of $50.3B.

  • Revenue in the twelve months to 31 Mar 2026: $17.9B. The latest quarter shrank 1.2% year on year.

  • Net income over the same four quarters: $1.2B, a 6.6% net margin.

  • Diluted earnings per share, trailing twelve months: $1.70.

  • Free cash flow in the twelve months to 31 Mar 2026: $2.0B, after $578.0M of capital spending.

  • Vylor, Inc. spent $1.1B on share buybacks and $176.0M on dividends in the twelve months to 31 Mar 2026.

  • Shares outstanding: 667.3M.

  • Trailing P/E: 101.8×; forward P/E: 27.3× — the forward figure prices analyst consensus estimates, not reported earnings.

  • Forward dividend yield: 0.72%, paying out 0% of earnings.

  • Vylor, Inc. employs 21,500 people — $832K of revenue per employee.

Statement figures: company filings via Twelve Data, four quarters to 31 Mar 2026 · market figures as at 5 Nov 2026

Data provided by Twelve Data

Peers

VYLR vs competitors

The nearest names by industry and size, scored by the same model — like for like.

Its peer group, ranked by the same modelShell Companies
CompanyMarket capTKN rank
VYLRVylor, Inc.$47.5B0
STTState Street Corp.*$46.1B88
AMPAmeriprise Financial, Inc.*$44.2B82
ARESAres Management Corp.*$43.9B26
MSCIMSCI, Inc.*$48.2B62
FITBFifth Third Bancorp*$48.7B16
PRUPrudential Financial, Inc.*$42.9B63

* Nearest Financial Services names by size — few shell companies companies of this scale trade in the US universe.

Look up any of the roughly 4,600 stocks we score.

The rank is the raw material. Whether the rules would actually own Vylor, Inc. — and when they’d sell — is the membership. See the Ticker Nerd 20 →

News

Latest VYLR news & analysis

Vylor Declares Quarterly Dividend

PRNewsWire · 22 Oct 2026positive

Vylor’s Board authorized a quarterly common stock dividend of $0.13 per share, payable December 7, 2026, to shareholders of record on November 30, 2026.

Why it matters — VYLR watchers may note the announced dividend amount and the payment and record dates.

Vylor Announces $3 Billion Share Repurchase Program

PRNewsWire · 22 Oct 2026positive

Vylor’s board authorized a new, multi-year $3 billion share repurchase program, effective immediately and without an expiration date. Repurchases may occur periodically in open-market or private transactions.

Why it matters — The authorization outlines Vylor’s planned approach to returning capital to shareholders as part of its stated capital allocation strategy.

Vylor: A Food Scarcity Play With Growth Optionality

Seeking Alpha · 13 Oct 2026positive

Seeking Alpha describes Vylor as a food-security investment theme, citing its yield-enhancement technologies and settlement with Bayer as potential sources of growth and licensing income. The excerpt says Vylor targets 7%-8% annualized EBITDA CAGR and 300 basis points of margin expansion through FY26-29, with additional potential from hybrid wheat and biofuel ventures.

Why it matters — The stated targets, licensing income, and venture opportunities are relevant to VYLR watchers assessing the company’s growth drivers.

Corteva Completes Vylor Spin-Off: CTVA Vs. VYLR — Which Stock Is The Better Play Now?

Benzinga · 7 Oct 2026neutral

Corteva completed the spin-off of its seed operating segment into Vylor on October 1, 2026, via a pro rata distribution. Holders of record on September 24 received one VYLR share for each CTVA share held.

Why it matters — The distribution details explain how eligible Corteva shareholders received Vylor shares as the company was spun off.

Vylor Announces Dates for Third Quarter 2026 Earnings Release and Webcast

PRNewsWire · 6 Oct 2026neutral

Vylor announced that it will release third-quarter 2026 earnings after market close on Wednesday, November 11, via press release and its website. A live webcast presenting the earnings is scheduled for Thursday, November 12, at 9:00 a.m.

Why it matters — VYLR watchers can note the dates and format for the company's upcoming quarterly earnings release and presentation.

FAQ

Frequently asked questions about VYLR stock

What is the VYLR stock price forecast for 2026-2027?

The 16 Wall Street analysts covering Vylor, Inc. have a median 12-month price target of $85, with estimates ranging from $74 to $90. These are third-party analyst estimates, not Ticker Nerd forecasts, and they are frequently wrong.

Is VYLR stock a buy right now?

Of the 16 analysts covering Vylor, Inc., 11 rate it a Buy, 5 a Hold and 0 a Sell. Ticker Nerd's systematic factor model ranks Vylor, Inc. 0 out of 100 across roughly 4,600 US stocks as at 5 Nov 2026. None of this is personal advice — it does not consider your circumstances.

How does Ticker Nerd's model rank VYLR?

As at 5 Nov 2026, Vylor, Inc. ranks 0 out of 100 on Ticker Nerd's systematic factor model — a percentile across roughly 4,600 US stocks, built from its factor families. Its strongest factor family is Revisions (37 of 100).

Will VYLR stock go up?

No one can know that. What the data says: the median 12-month target from 16 analysts implies +23.3% from the last close, and Ticker Nerd's factor model ranks Vylor, Inc. 0 out of 100 as at 5 Nov 2026. Analyst targets are third-party estimates and frequently wrong; none of this is personal advice.

What is the VYLR stock forecast for 2030?

No analyst covering Vylor, Inc. publishes a 2030 price target — Wall Street targets run 12 to 18 months out. Sites quoting a 2030 price for VYLR are extrapolating price history, which says nothing about the business. The furthest attributed numbers are the current analyst targets: $74 to $90 over the next 12 months.

What does Vylor, Inc. do?

Vylor Inc. is an agricultural services company focused on supporting crop production and related farming operations.

What is the latest news on VYLR?

The most recent item we track (PRNewsWire, 22 Oct 2026): "Vylor Declares Quarterly Dividend". Vylor’s Board authorized a quarterly common stock dividend of $0.13 per share, payable December 7, 2026, to shareholders of record on November 30, 2026.

Company

About Vylor, Inc.

Vylor Inc. is an agricultural services company focused on supporting crop production and related farming operations. Its activities are centered on agricultural production services that help producers manage cultivation processes, improve operational efficiency, and bring crops through key stages of the farming cycle. The company operates within the broader agribusiness sector, serving an industry connected to food supply chains, commodity markets, farm management, and rural economic activity. Vylor Inc. is based in Johnston, Iowa, placing it within a major U.S. agricultural region. As an agricultural services provider, the company’s role extends beyond direct crop cultivation by contributing operational expertise and production support to farming activities. Its business is relevant to commercial agriculture and the infrastructure that connects growers with processors, distributors, and end markets. Vylor Inc. represents an agricultural-focused enterprise whose primary purpose is to facilitate crop production and support the functioning of modern farming operations.

CEO Mr. Charles Victor Magro B.Sc. (Chem), MBA · 21,500 employees · United States · https://www.vylor.com