WKWKTechnology · Software - Application

WK Stock Forecast: Workiva, Inc. Price Predictions for 2026-2027

Last close, 5 Oct 2026
$72
+0.91% on the day

The 11 Wall Street analysts covering Workiva, Inc. hold a median 12-month price target of $90 — +25.2% from the last close. Ticker Nerd's systematic factor model, run across ~4,600 US stocks, ranks it 99 of 100 as at 3 Oct 2026 — among the strongest tenth. Here, the model and the Street point the same way.

Market cap
$4.0B
Ticker Nerd rank
99 / 100
Median analyst target
$90
Analysts covering
11
Revenue$255.3M+18.6% y/y
Operating income$11.7M
Net income$13.4M
Free cash flow$78.0M
Quarterly, 8 quarters to 30 June 2026 · latest quarter's figure shown
Total return, dividends reinvested
1W
+5.4%
1M
−6.1%
YTD
−16.7%
1Y
−18.1%
From 52W high
−23.0%
From 52W low
+62.2%
$44
$93
52-week range, adjusted closes · the dot is the last close
Ticker Nerd rank

WK stock analysis: one number for the whole business

Consensus tells you what everyone already believes. The model scores Workiva, Inc. on its factor families — the same systematic rank behind the Ticker Nerd portfolio.

Where the model ranks itAs at 3 Oct 2026
99 / 100

Percentile across ~4,600 US stocks on Ticker Nerd’s systematic factor model. Higher is better. How the model is built and tested

Revisions
99
Volatility
94
Accruals
90
Quality
89
Growth
87
Issuance
80
Value
68
Momentum
48
Size
26

Revisions (99): Analysts have, on balance, been raising their forecasts.

Momentum (48): The shares have been drifting down relative to others.

Size (26): Larger than most of the companies we track — more scrutinised, less often mispriced.

Built and run by Aslam Ghouse, an ex-Goldman Sachs quant trader with fourteen years in markets.

The Ticker Nerd Read

Workiva's rank is near the top; the stock's year is not.

Our factor model ranks Workiva 98.6 of 100 as of October 2, 2026, above 98% of the roughly 4,600 US stocks it tracks. That is 4th of 200 in its industry. Estimate revisions (99.5), quality (88.6) and growth (87.2) carry it; momentum (47.8) and market size (26.2) weigh on it.

The rank and the price history disagree. The shares closed at $71.22 on October 2, 2026, down 18.6% over the prior twelve months, while the S&P 500 gained 16.2%. Wall Street agrees with the model: all 11 analysts rate it buy or strong buy, with an average target of $89.80.

The rank leans on the revision cycle. Analysts raised the consensus earnings estimate for the current year by 15.4% in the 90 days to September 29, 2026; ten raised last month, none cut. The next quarterly report will show whether the June-quarter trend holds: revenue up 18.6% year over year, profit of $13.4 million, after a loss a year earlier.

Momentum is the factor to watch: it ranks 47.8 even though shares rose 37.1% over three months to October 2, 2026. The weak velocity component (19.7) means recent price action has lagged other stocks. Workiva unveiled new AI tools for regulatory work at its September 2026 Amplify conference; the next earnings call is the first test of their effect.

As of 3 Oct 2026
Wall Street

WK stock forecast 2026-2027: analyst price targets & predictions

The bullish and bearish analyst opinions on WK, reported as data — targets and ratings, the market's view beside the model's.

Share price and the analyst range, 12 monthsAdjusted close, US dollars
$40$50$60$70$80$90$100$110Jan 26Apr 26Jul 26Oct 26WKHigh $105Median $90Low $80

Price targets and ratings are third-party analyst estimates, reported here as data. They are not Ticker Nerd forecasts, and they are frequently wrong.

Data provided by Twelve Data

What Wall Street says11 analysts
11 Buy0 Hold0 Sell
Low $80Median $90High $105

The green dot is the last close — the median target sits +25.2% from it.

Recent analyst actionsNewest first

Of the 20 most recent actions, 3 moved their price target up and 1 moved it down.

DateFirmActionRatingTarget
16 Sept 2026BairdMaintainsOutperform$95 → $105
11 Sept 2026BTIGMaintainsBuy$70 → $80
1 Sept 2026BairdMaintainsOutperform—
1 Sept 2026BairdMaintainsOutperform$74 → $95
5 Aug 2026BTIGMaintainsBuy—
5 Aug 2026BTIGMaintainsBuy$80 → $70
26 May 2026Stephens & Co.ReiteratesOverweight—
26 May 2026Stephens & Co.ReiteratesOverweight$68
6 May 2026BTIGMaintainsBuy—
6 May 2026StifelMaintainsBuy—
20 Feb 2026BairdMaintainsOutperform—
20 Feb 2026BTIGMaintainsBuy—
20 Feb 2026StifelMaintainsBuy—
20 Feb 2026Truist SecuritiesReiteratesBuy—
17 Dec 2025BTIGInitiatesBuy—
10 Nov 2025Stephens & Co.MaintainsOverweight—
7 Nov 2025Truist SecuritiesMaintainsBuy—
6 Nov 2025BMO CapitalMaintainsOutperform—
30 Sept 2025BMO CapitalMaintainsOutperform—
11 Sept 2025CitigroupMaintainsBuy—

Price targets and ratings are third-party analyst estimates, reported here as data. They are not Ticker Nerd forecasts, and they are frequently wrong.

Market Radar

This page is one stock. Monday covers all of them.

Computed off the Friday close and sent before the US open.

Market Radar reports the week’s largest rank changes across roughly 4,600 US stocks, the factor behind each one, and where the market went. WK appears on the weeks it earns a place.

Free, every Monday. Unsubscribe any time.

Performance

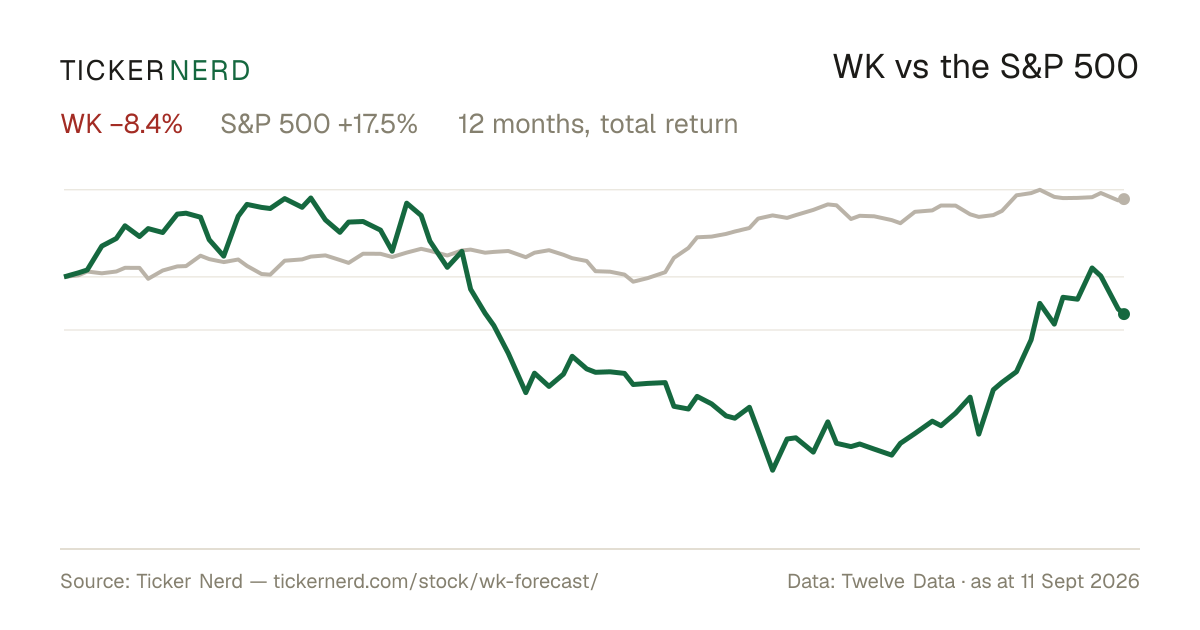
WK vs the S&P 500

Both lines are total return — dividends reinvested — so the comparison is honest on both sides.

Over the twelve months to 5 Oct 2026, Workiva, Inc. returned −18.1% against +17.0% for the S&P 500, dividends included.

WK vs S&P 500, last 12 monthsTotal return, rebased to 100
406080100120Jan 26Apr 26Jul 26Oct 26WKS&P 500

Download this chart as an image — free to reuse; link this page as the source.

Data provided by Twelve Data

Estimates

WK analyst estimate revisions

Not the forecast itself — the direction analysts are revising it. Revision direction is one of the model's factor families.

Which way the estimates are movingNext fiscal year
EPS revision, 90 days
+15.4%
Analysts raising
10
Analysts cutting
0
Fundamentals

Workiva, Inc. (WK) financial data

A margin means little on its own. Each bar marks where the figure sits across the whole US universe we score.

Valuation
Trailing P/E
84.8×

Cheaper than 9% of US stocks

Price / sales
4.1×

Cheaper than 29% of US stocks

Price / book
−40.8×

Cheaper than 99% of US stocks

EV / EBITDA
91.7×

Cheaper than 2% of US stocks

Growth & margins
Revenue growth (YoY)
18.6%

Higher than 67% of US stocks

Earnings growth (YoY)
18.6%

Higher than 57% of US stocks

Gross margin
80.4%

Higher than 91% of US stocks

Operating margin
4.6%

Higher than 54% of US stocks

Net margin
4.9%

Higher than 59% of US stocks

Returns & dividend
Return on equity
481.4%

Higher than 99% of US stocks

Return on assets
1.4%

Higher than 55% of US stocks

Dividend yield
0.0%

Higher than 1% of US dividend payers

Bars mark the percentile across the ~4,600 US stocks Ticker Nerd covers, among those reporting the figure.

Key statistics

Workiva, Inc. (WK) statistics: revenue, profit & scale

The headline figures, each with its date. Every row carries its own link — cite it straight from here.

  • Workiva, Inc. has a market value of $4.0B and an enterprise value of $3.9B.

  • Revenue in the twelve months to 30 June 2026: $965.7M. The latest quarter grew 18.6% year on year.

  • Net income over the same four quarters: $47.0M, a 4.9% net margin.

  • Diluted earnings per share, trailing twelve months: $0.83.

  • Free cash flow in the twelve months to 30 June 2026: $200.1M.

  • Workiva, Inc. spent $194.2M on share buybacks in the twelve months to 30 June 2026.

  • Shares outstanding: 54.1M.

  • Trailing P/E: 84.8×; forward P/E: 17.6× — the forward figure prices analyst consensus estimates, not reported earnings.

  • Forward dividend yield: 0.00%, paying out 0% of earnings.

  • Workiva, Inc. employs 2,887 people — $334K of revenue per employee.

Statement figures: company filings via Twelve Data, four quarters to 30 June 2026 · market figures as at 5 Oct 2026

Data provided by Twelve Data

Peers

WK vs competitors

The nearest names by industry and size, scored by the same model — like for like.

Its peer group, ranked by the same modelSoftware - Application
CompanyMarket capTKN rank
WKWorkiva, Inc.$4.0B
99
BULLWebull Corp.$3.8B
45
FSLYFastly, Inc.$3.9B
92
CCCCCC Intelligent Solutions Holdings, Inc.$4.0B
75
BILLBill Holdings, Inc.$3.7B
83
SRADSportradar Group AG$3.7B
51
QTWOQ2 Holdings, Inc.$3.5B
95

Look up any of the roughly 4,600 stocks we score.

The rank is the raw material. Whether the rules would actually own Workiva, Inc. — and when they’d sell — is the membership. See the Ticker Nerd 20 →

News

Latest WK news & analysis

Vylor Added to the S&P 500; Twilio Set to Join S&P 500; Others to Join S&P MidCap 400 and S&P SmallCap 600

PRNewsWire · 1 Oct 2026neutral

S&P Dow Jones Indices announced several index changes, including Vylor Inc. being added to the S&P 500 on October 1 after being spun off from Corteva Inc., which was replaced in the index. Twilio is also set to join the S&P 500, with other companies joining the S&P MidCap 400 and S&P SmallCap 600.

Why it matters — Index membership changes can influence stock liquidity and investor attention, so a WK watcher may note whether these adjustments affect related market dynamics.

Buy 3 Top-Ranked Mid-Cap Big Data Stocks Amid Solid Short-Term Upside

Zacks Investment Research · 21 Sept 2026positive

Zacks Investment Research highlights Workiva (WK), along with ACIW and ESTC, as top-ranked mid-cap big data stocks, citing strong estimate revisions and brokerage targets pointing to potential short-term upside.

Why it matters — WK watchers would note that Workiva is being singled out with favorable analyst revision momentum and upside potential in the mid-cap big data space.

Workiva Inc. (WK) Analyst/Investor Day Transcript

Seeking Alpha · 16 Sept 2026neutral

Workiva Inc. held an Analyst/Investor Day, and Seeking Alpha published the full transcript of the event. The transcript covers the company's presentations and discussions during the day.

Why it matters — The transcript gives WK watchers direct access to management's commentary and strategic discussions from the company's investor event.

Workiva Advances Regulatory Work with AI Innovation

Business Wire · 15 Sept 2026positive

Workiva unveiled dozens of new product and platform innovations at its Amplify 2026 conference, including the debut of Agent Studio, a platform capability that lets users build, customize, and deploy AI agents within Workiva.

Why it matters — A WK watcher would care because this signals the company is advancing its regulatory and reporting platform with new AI capabilities that could appeal to its finance, accounting, sustainability, and compliance customers.

Workiva to Host 2026 Analyst & Investor Day

Business Wire · 14 Sept 2026neutral

Workiva announced it will host its 2026 Analyst & Investor Day on Tuesday, September 15, 2026, at 10:00 a.m. Pacific Time during its annual Amplify user conference in Las Vegas. A live webcast and replay will be available for a limited time on the company's investor relations website.

Why it matters — WK watchers would be interested because the analyst event offers an opportunity for company executives to provide updates and insights to investors and analysts.

FAQ

Frequently asked questions about WK stock

What is the WK stock price forecast for 2026-2027?

The 11 Wall Street analysts covering Workiva, Inc. have a median 12-month price target of $90, with estimates ranging from $80 to $105. These are third-party analyst estimates, not Ticker Nerd forecasts, and they are frequently wrong.

Is WK stock a buy right now?

Of the 11 analysts covering Workiva, Inc., 11 rate it a Buy, 0 a Hold and 0 a Sell. Ticker Nerd's systematic factor model ranks Workiva, Inc. 99 out of 100 across roughly 4,600 US stocks as at 3 Oct 2026. None of this is personal advice — it does not consider your circumstances.

How does Ticker Nerd's model rank WK?

As at 3 Oct 2026, Workiva, Inc. ranks 99 out of 100 on Ticker Nerd's systematic factor model — a percentile across roughly 4,600 US stocks, built from its factor families. Its strongest factor family is Revisions (99 of 100).

Will WK stock go up?

No one can know that. What the data says: the median 12-month target from 11 analysts implies +25.2% from the last close, and Ticker Nerd's factor model ranks Workiva, Inc. 99 out of 100 as at 3 Oct 2026. Analyst targets are third-party estimates and frequently wrong; none of this is personal advice.

What is the WK stock forecast for 2030?

No analyst covering Workiva, Inc. publishes a 2030 price target — Wall Street targets run 12 to 18 months out. Sites quoting a 2030 price for WK are extrapolating price history, which says nothing about the business. The furthest attributed numbers are the current analyst targets: $80 to $105 over the next 12 months.

How has WK stock performed over the past year?

Workiva, Inc. returned -18.1% over the 12 months to 5 Oct 2026, with dividends reinvested. Past performance does not indicate future returns.

What does Workiva, Inc. do?

Workiva sells cloud software for the reporting that regulated businesses must file: financial statements, sustainability disclosures, regulatory submissions, and audit and risk workflows. Finance, legal, compliance and sustainability teams use it to pull data from many business systems into one controlled, review-ready document.

What is the latest news on WK?

The most recent item we track (PRNewsWire, 1 Oct 2026): "Vylor Added to the S&P 500; Twilio Set to Join S&P 500; Others to Join S&P MidCap 400 and S&P SmallCap 600". S&P Dow Jones Indices announced several index changes, including Vylor Inc. being added to the S&P 500 on October 1 after being spun off from Corteva Inc., which was replaced in the index. Twilio is also set to join the S&P 500, with other companies joining the S&P MidCap 400 and S&P SmallCap 600.

Why is Workiva's price-to-book ratio negative?

Workiva's stockholders' equity was minus $97.1 million as of June 30, 2026, while total assets were $1.37 billion. A negative book value makes the price-to-book ratio an arithmetic artifact rather than a usable measure of value.

How does Workiva's cash flow compare with its reported profit?

Over the four quarters ended June 30, 2026, Workiva generated $200.1 million in free cash flow against $47.0 million in net income. Stock-based compensation, a non-cash expense, was $29.8 million in the quarter ended June 30, 2026.

Company

About Workiva, Inc.

Workiva sells cloud software for the reporting that regulated businesses must file: financial statements, sustainability disclosures, regulatory submissions, and audit and risk workflows. Finance, legal, compliance and sustainability teams use it to pull data from many business systems into one controlled, review-ready document. Workiva is headquartered in Ames, Iowa, employs 2,887 people, and reported $965.7 million in revenue for the four quarters ended June 30, 2026.

CEO Ms. Julie Iskow · 2,887 employees · United States · https://www.workiva.com