CGONCGONHealthcare · Biotechnology

CGON Stock Forecast: CG Oncology, Inc. Price Predictions for 2026-2027

Last close, 11 Sept 2026
$72
+0.47% on the day

The 15 Wall Street analysts covering CG Oncology, Inc. hold a median 12-month price target of $90 — +24.4% from the last close. Ticker Nerd's systematic factor model, run across ~4,600 US stocks, ranks it 17 of 100 as at 12 Sept 2026 — in the weakest quartile. The Street sees upside; the factor read is a caution. That gap is the story on this page.

Market cap
$6.4B
Ticker Nerd rank
17 / 100
Median analyst target
$90
Analysts covering
15
Revenue$1.2M
Operating income−$86.4M
Net income−$79.1M
Free cash flow−$46.9M
Quarterly, 8 quarters to 30 June 2026 · latest quarter's figure shown
Total return, dividends reinvested
1W
−2.7%
1M
−6.1%
YTD
+74.2%
1Y
+118.1%
From 52W high
−10.3%
From 52W low
+118.1%
$33
$81
52-week range, adjusted closes · the dot is the last close
Ticker Nerd rank

CGON stock analysis: one number for the whole business

Consensus tells you what everyone already believes. The model scores CG Oncology, Inc. on its factor families — the same systematic rank behind the Ticker Nerd portfolio.

Where the model ranks itAs at 12 Sept 2026
17 / 100

Percentile across ~4,600 US stocks on Ticker Nerd’s systematic factor model. Higher is better. How the model is built and tested

Momentum
91
Growth
60
Revisions
34
Accruals
30
Issuance
26
Value
25
Volatility
25
Size
20
Quality
10

Momentum (91): The shares have been drifting up relative to others.

Quality (10): Profits are thin or unreliable for the size of the business, or they are not turning into cash.

Built and run by Aslam Ghouse, an ex-Goldman Sachs quant trader with fourteen years in markets.

Wall Street

CGON stock forecast 2026-2027: analyst price targets & predictions

The bullish and bearish analyst opinions on CGON, reported as data — targets and ratings, the market's view beside the model's.

Share price and the analyst range, 12 monthsAdjusted close, US dollars
$20$40$60$80$100$120Oct 25Jan 26Apr 26Jul 26CGONHigh $108Median $90Low $79

Price targets and ratings are third-party analyst estimates, reported here as data. They are not Ticker Nerd forecasts, and they are frequently wrong.

Data provided by Twelve Data

What Wall Street says15 analysts
14 Buy1 Hold0 Sell
Low $79Median $90High $108

The green dot is the last close — the median target sits +24.4% from it.

Recent analyst actionsNewest first

Of the 20 most recent actions, 3 moved their price target up and 1 moved it down.

DateFirmActionRatingTarget
7 Aug 2026Piper SandlerMaintainsOverweight$82$85
7 Aug 2026RBC CapitalMaintainsOutperform$81$79
7 Aug 2026Truist SecuritiesMaintainsBuy$82$85
19 May 2026Wolfe ResearchInitiatesPeer Perform
18 May 2026HC Wainwright & Co.ReiteratesBuy$100
18 May 2026HC Wainwright & Co.ReiteratesBuy
14 May 2026Truist SecuritiesReiteratesBuy$77$82
14 May 2026Truist SecuritiesReiteratesBuy
11 May 2026JP MorganMaintainsOverweight
11 May 2026RBC CapitalMaintainsOutperform
11 May 2026Truist SecuritiesReiteratesBuy
11 May 2026WedbushMaintainsOutperform
27 Apr 2026RBC CapitalMaintainsOutperform
17 Apr 2026JP MorganMaintainsOverweight
7 Apr 2026HC Wainwright & Co.MaintainsBuy
27 Feb 2026HC Wainwright & Co.MaintainsBuy
10 Feb 2026Truist SecuritiesMaintainsBuy
21 Jan 2026RBC CapitalMaintainsOutperform
16 Jan 2026Piper SandlerMaintainsOverweight

Price targets and ratings are third-party analyst estimates, reported here as data. They are not Ticker Nerd forecasts, and they are frequently wrong.

Market Radar

This page is one stock. Monday covers all of them.

Computed off the Friday close and sent before the US open.

Market Radar reports the week’s largest rank changes across roughly 4,600 US stocks, the factor behind each one, and where the market went. CGON appears on the weeks it earns a place.

Free, every Monday. Unsubscribe any time.

Performance

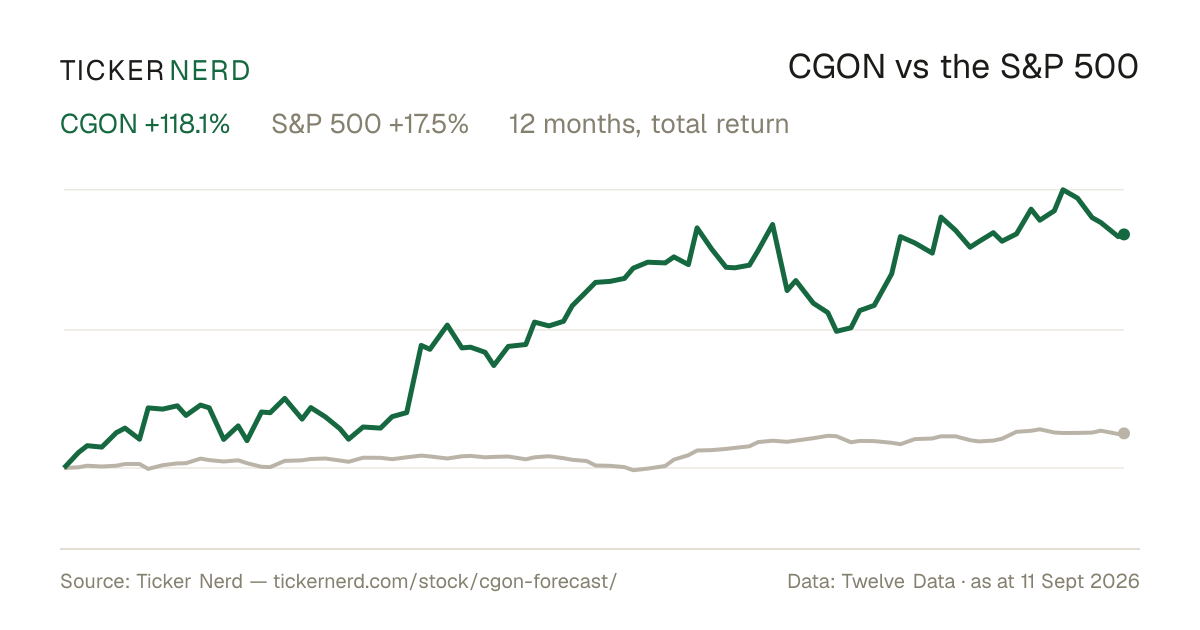
CGON vs the S&P 500

Both lines are total return — dividends reinvested — so the comparison is honest on both sides.

Over the twelve months to 11 Sept 2026, CG Oncology, Inc. returned +118.1% against +17.5% for the S&P 500, dividends included.

CGON vs S&P 500, last 12 monthsTotal return, rebased to 100
100150200250Oct 25Jan 26Apr 26Jul 26CGONS&P 500

Download this chart as an image — free to reuse; link this page as the source.

Data provided by Twelve Data

Estimates

CGON analyst estimate revisions

Not the forecast itself — the direction analysts are revising it. Revision direction is one of the model's factor families.

Which way the estimates are movingNext fiscal year
Analysts raising
0
Analysts cutting
10
Fundamentals

CG Oncology, Inc. (CGON) financial data

A margin means little on its own. Each bar marks where the figure sits across the whole US universe we score.

Valuation
Trailing P/E
−34.8×

Cheaper than 98% of US stocks

Price / sales
1029.7×

Cheaper than 1% of US stocks

Price / book
6.2×

Cheaper than 16% of US stocks

EV / EBITDA
−21.6×

Cheaper than 90% of US stocks

Growth & margins
Revenue growth (YoY)
6.8%

Higher than 44% of US stocks

Earnings growth (YoY)
1982.7%

Higher than 98% of US stocks

Gross margin
−239.2%

Higher than 1% of US stocks

Operating margin
−7467.7%

Higher than 2% of US stocks

Net margin
−15.0%

Higher than 17% of US stocks

Returns & dividend
Return on equity
−26.4%

Higher than 28% of US stocks

Return on assets
−17.7%

Higher than 21% of US stocks

Dividend yield

Bars mark the percentile across the ~4,600 US stocks Ticker Nerd covers, among those reporting the figure.

Key statistics

CG Oncology, Inc. (CGON) statistics: revenue, profit & scale

The headline figures, each with its date. Every row carries its own link — cite it straight from here.

  • CG Oncology, Inc. has a market value of $6.4B and an enterprise value of $5.4B.

  • Revenue in the twelve months to 30 June 2026: $6.2M. The latest quarter grew 6.8% year on year.

  • Net income over the same four quarters: −$224.4M, a −3602.7% net margin.

  • Free cash flow in the twelve months to 30 June 2026: −$179.3M.

  • Shares outstanding: 88.3M.

  • Trailing P/E: −34.8×; forward P/E: −24.0× — the forward figure prices analyst consensus estimates, not reported earnings.

  • CG Oncology, Inc. employs 142 people $44K of revenue per employee.

Statement figures: company filings via Twelve Data, four quarters to 30 June 2026 · market figures as at 14 Sept 2026

Data provided by Twelve Data

Peers

CGON vs competitors

The nearest names by industry and size, scored by the same model — like for like.

Its peer group, ranked by the same modelBiotechnology
CompanyMarket capTKN rank
CGONCG Oncology, Inc.$6.4B
17
MIRMMirum Pharmaceuticals, Inc.$6.4B
67
TVTXTravere Therapeutics, Inc.$6.2B
87
ORKAOruka Therapeutics, Inc.$6.1B
40
SRRKScholar Rock Holding Corp.$6.7B
37
CAICaris Life Sciences, Inc.$6.9B
32
DNTHDianthus Therapeutics, Inc.$5.8B
61

Look up any of the roughly 4,600 stocks we score.

The rank is the raw material. Whether the rules would actually own CG Oncology, Inc. — and when they’d sell — is the membership. See the Ticker Nerd 20 →

News

Latest CGON news & analysis

3 Stocks Call Traders Are Targeting Today

Schaeffers Research · 11 Sept 2026neutral

Schaeffers Research reports that YPF, CGON, and IE are seeing unusually heavy call volume from options traders today. The item highlights CGON among stocks drawing notable options activity.

Why it matters — Heavy call volume in CGON indicates elevated trader interest and options activity in the stock, which a CGON watcher would want to be aware of.

15 Stocks to Watch With Short Squeeze Potential

Schaeffers Research · 2 Sept 2026neutral

Schaeffers Research published a list of 15 stocks with short squeeze potential, noting that bond yields have put markets on edge and that most investors are not currently focused on short squeezes. The piece suggests such stocks could be of interest to contrarian traders.

Why it matters — CGON was featured among stocks with short squeeze potential, which may be of interest to watchers tracking positioning and contrarian trading dynamics.

CG Oncology to Present at Upcoming Investor Conferences in September

GlobeNewsWire · 2 Sept 2026neutral

CG Oncology announced that CEO Arthur Kuan will participate in fireside chat presentations at the Cantor Fitzgerald and Morgan Stanley Global Healthcare Conferences in New York City in September 2026. The company disclosed details of the upcoming investor conference events.

Why it matters — CG Oncology watchers would care because the presentations offer an opportunity for investors to hear directly from the CEO at two major healthcare conferences.

CG Oncology: Circling Back After Huge Rally

Seeking Alpha · 14 Aug 2026positive

CG Oncology is advancing cretositimogene grenadenorepvec (cret) for NMIBC, reporting strong efficacy and best-in-class safety versus competitors, including a 75% anytime CR, 46% 12-month CR, and 42% 24-month CR in BOND-003 Cohort C with no Grade 3+ adverse events. The rolling BLA for cret in HR BCG-unresponsive NMIBC is expected to complete in 4Q26, with multiple trial readouts in 2H26 and 2027.

Why it matters — CGON watchers would care because the cret efficacy and safety data, along with the upcoming BLA completion and trial readouts, mark key regulatory and clinical milestones for the company's lead program.

CG Oncology, Inc. (CGON) Reports Q2 Loss, Misses Revenue Estimates

Zacks Investment Research · 6 Aug 2026negative

CG Oncology, Inc. reported a quarterly loss of $0.9 per share for the quarter, which was wider than the Zacks Consensus Estimate of a $0.7 loss and compared with a loss of $0.54 per share a year earlier. The company missed revenue estimates.

Why it matters — CGON watchers would care because the company's quarterly results came in below analyst expectations on both earnings and revenue.

FAQ

Frequently asked questions about CGON stock

What is the CGON stock price forecast for 2026-2027?

The 15 Wall Street analysts covering CG Oncology, Inc. have a median 12-month price target of $90, with estimates ranging from $79 to $108. These are third-party analyst estimates, not Ticker Nerd forecasts, and they are frequently wrong.

Is CGON stock a buy right now?

Of the 15 analysts covering CG Oncology, Inc., 14 rate it a Buy, 1 a Hold and 0 a Sell. Ticker Nerd's systematic factor model ranks CG Oncology, Inc. 17 out of 100 across roughly 4,600 US stocks as at 12 Sept 2026. None of this is personal advice — it does not consider your circumstances.

How does Ticker Nerd's model rank CGON?

As at 12 Sept 2026, CG Oncology, Inc. ranks 17 out of 100 on Ticker Nerd's systematic factor model — a percentile across roughly 4,600 US stocks, built from its factor families. Its strongest factor family is Momentum (91 of 100).

Will CGON stock go up?

No one can know that. What the data says: the median 12-month target from 15 analysts implies +24.4% from the last close, and Ticker Nerd's factor model ranks CG Oncology, Inc. 17 out of 100 as at 12 Sept 2026. Analyst targets are third-party estimates and frequently wrong; none of this is personal advice.

What is the CGON stock forecast for 2030?

No analyst covering CG Oncology, Inc. publishes a 2030 price target — Wall Street targets run 12 to 18 months out. Sites quoting a 2030 price for CGON are extrapolating price history, which says nothing about the business. The furthest attributed numbers are the current analyst targets: $79 to $108 over the next 12 months.

How has CGON stock performed over the past year?

CG Oncology, Inc. returned +118.1% over the 12 months to 11 Sept 2026, with dividends reinvested. Past performance does not indicate future returns.

What does CG Oncology, Inc. do?

CG Oncology Inc. is a clinical biopharmaceutical company focused on bladder cancer, with an emphasis on bladder-sparing therapies for patients with non-muscle invasive disease.

What is the latest news on CGON?

The most recent item we track (Schaeffers Research, 11 Sept 2026): "3 Stocks Call Traders Are Targeting Today". Schaeffers Research reports that YPF, CGON, and IE are seeing unusually heavy call volume from options traders today. The item highlights CGON among stocks drawing notable options activity.

Company

About CG Oncology, Inc.

CG Oncology Inc. is a clinical biopharmaceutical company focused on bladder cancer, with an emphasis on bladder-sparing therapies for patients with non-muscle invasive disease. The company’s lead product candidate, cretostimogene grenadenorepvec, is an intravesically delivered oncolytic immunotherapy designed to act directly within the bladder and engage the immune system against tumors. CG Oncology is developing this therapy across multiple current clinical programs for high-risk and intermediate-risk bladder cancer settings, including combination studies with other oncology treatments. The company’s work centers on addressing unmet needs in urologic oncology through localized treatment approaches that aim to preserve the bladder while targeting disease at the source.

CEO Mr. Arthur Kuan · 142 employees · United States · https://cgoncology.com