DAVEDAVETechnology · Software - Application

DAVE Stock Forecast: Dave, Inc. Price Predictions for 2026-2027

Last close, 14 Aug 2026
$335
+0.24% on the day

The 12 Wall Street analysts covering Dave, Inc. hold a median 12-month price target of $450 — +34.5% from the last close. Ticker Nerd's systematic factor model, run across ~4,600 US stocks, ranks it 46 of 100 as at 15 Aug 2026 — in the lower half.

Market cap
$4.3B
Ticker Nerd rank
46 / 100
Median analyst target
$450
Analysts covering
12
Total return, dividends reinvested
1W
+5.2%
1M
−19.8%
YTD
+51.1%
1Y
+66.4%
From 52W high
−24.4%
From 52W low
+114.6%
$156
$443
52-week range, adjusted closes · the dot is the last close
Ticker Nerd rank

DAVE stock analysis: one number for the whole business

Consensus tells you what everyone already believes. The model scores Dave, Inc. on its factor families — the same systematic rank behind the Ticker Nerd portfolio.

Where the model ranks itAs at 15 Aug 2026
46 / 100

Percentile across ~4,600 US stocks on Ticker Nerd’s systematic factor model. Higher is better. How the model is built and tested

Quality
100
Growth
95
Momentum
94
Revisions
55
Issuance
32
Size
26
Value
12
Accruals
11
Volatility
1

Quality (100): The business earns solid, repeatable profits on what it owns.

Volatility (1): The share price moves around a lot.

Built and run by Aslam Ghouse, an ex-Goldman Sachs quant trader with fourteen years in markets.

Wall Street

DAVE stock forecast 2026-2027: analyst price targets & predictions

The bullish and bearish analyst opinions on DAVE, reported as data — targets and ratings, the market's view beside the model's.

Share price and the analyst range, 12 monthsAdjusted close, US dollars
$100$200$300$400$500Oct 25Jan 26Apr 26Jul 26DAVEHigh $490Median $450Low $310

Price targets and ratings are third-party analyst estimates, reported here as data. They are not Ticker Nerd forecasts, and they are frequently wrong.

What Wall Street says12 analysts
10 Buy2 Hold0 Sell
Low $310Median $450High $490

The green dot is the last close — the median target sits +34.5% from it.

Recent analyst actionsNewest first

Of the 20 most recent actions, 8 moved their price target up and 0 moved it down.

DateFirmActionRatingTarget
11 Aug 2026Evercore ISI GroupMaintainsIn-Line$260$350
6 Aug 2026B. Riley SecuritiesMaintainsBuy$370$449
6 Aug 2026Canaccord GenuityMaintainsBuy$342$450
6 Aug 2026CitizensMaintainsMarket Outperform$450$475
6 Aug 2026Keefe, Bruyette & WoodsMaintainsOutperform$485$490
14 July 2026UBSMaintainsBuy$300$470
14 July 2026UBSMaintainsBuy
13 July 2026Keefe, Bruyette & WoodsMaintainsOutperform$340$485
13 July 2026Keefe, Bruyette & WoodsMaintainsOutperform
9 July 2026CitizensMaintainsMarket Outperform
9 July 2026CitizensMaintainsMarket Outperform$365$450
1 July 2026BenchmarkMaintainsBuy
12 June 2026Barrington ResearchMaintainsOutperform
27 May 2026B. Riley SecuritiesMaintainsBuy
27 May 2026Evercore ISI GroupInitiatesIn-Line
26 May 2026UBSInitiatesBuy
20 May 2026Barrington ResearchMaintainsOutperform
6 May 2026Canaccord GenuityMaintainsBuy
6 May 2026CitizensMaintainsMarket Outperform
6 May 2026Keefe, Bruyette & WoodsMaintainsOutperform

Price targets and ratings are third-party analyst estimates, reported here as data. They are not Ticker Nerd forecasts, and they are frequently wrong.

Market Radar

This page is one stock. Monday covers all of them.

Computed off the Friday close and sent before the US open.

Market Radar reports the week’s largest rank changes across roughly 4,600 US stocks, the factor behind each one, and where the market went. DAVE appears on the weeks it earns a place.

Free, every Monday. Unsubscribe any time.

Estimates

DAVE analyst estimate revisions

Not the forecast itself — the direction analysts are revising it. Revision direction is one of the model's factor families.

Which way the estimates are movingNext fiscal year
EPS revision, 90 days
+8.0%
Analysts raising
3
Analysts cutting
0
Fundamentals

Dave, Inc. (DAVE) financial data

A margin means little on its own. Each bar marks where the figure sits across the whole US universe we score.

Valuation
Trailing P/E
21.6×

Cheaper than 37% of US stocks

Price / sales
6.6×

Cheaper than 20% of US stocks

Price / book
20.9×

Cheaper than 5% of US stocks

EV / EBITDA
18.4×

Cheaper than 18% of US stocks

Growth & margins
Revenue growth (YoY)
29.6%

Higher than 78% of US stocks

Earnings growth (YoY)
−26.0%

Higher than 17% of US stocks

Gross margin
87.1%

Higher than 95% of US stocks

Operating margin
32.9%

Higher than 89% of US stocks

Net margin
34.6%

Higher than 92% of US stocks

Returns & dividend
Return on equity
104.8%

Higher than 96% of US stocks

Return on assets
31.0%

Higher than 99% of US stocks

Dividend yield

Bars mark the percentile across the ~4,600 US stocks Ticker Nerd covers, among those reporting the figure.

Peers

DAVE vs competitors

The nearest names by industry and size, scored by the same model — like for like.

Its peer group, ranked by the same modelSoftware - Application
CompanyMarket capTKN rank
DAVEDave, Inc.$4.3B
46
SRADSportradar Group AG$4.3B
50
CCCCCC Intelligent Solutions Holdings, Inc.$4.2B
72
BULLWebull Corp.$4.2B
19
LIFLife360, Inc.$4.1B
36
FSLYFastly, Inc.$4.5B
92
QTWOQ2 Holdings, Inc.$4.0B
93

Look up any of the roughly 4,600 stocks we score.

The rank is the raw material. Whether the rules would actually own Dave, Inc. — and when they’d sell — is the membership. See the Ticker Nerd 20 →

News

Latest DAVE news & analysis

Should You Buy Dave Stock After Its Q2 Earnings and Recent Pullback?

Zacks Investment Research · 10 Aug 2026neutral

Dave, Inc. reported Q2 results with revenues up 30% and EBITDA up 48%, though slowing growth triggered a pullback in the stock. Management's guidance, margins, and credit trends reportedly improved during the period.

Why it matters — DAVE watchers would care because the report highlights both strong Q2 growth and improved guidance and credit trends, alongside investor concern over decelerating growth.

SPACs Are Roaring Back. This Red-Hot Stock Is a Cautionary Tale.

Barrons · 7 Aug 2026negative

The news item notes that Dave lost 97% of its value before completing a 1-for-32 reverse split, yet has since surged back. It frames the stock as a cautionary tale amid renewed SPAC enthusiasm.

Why it matters — DAVE watchers would care because the report highlights the stock's extreme volatility and past steep decline, serving as a cautionary backdrop for its recent rally.

Why Dave Stock Got Thrashed on Thursday

The Motley Fool · 6 Aug 2026negative

Dave's stock fell sharply on Thursday despite the company continuing to deliver double-digit growth, handily beating analyst consensus on profitability, and raising its full-year guidance.

Why it matters — DAVE watchers would note that the share-price decline occurred even as the company posted strong growth and improved its outlook, highlighting a disconnect between market reaction and fundamentals.

DAVE's Q2 Earnings Call Highlights CashAI-Led Growth Push

Zacks Investment Research · 6 Aug 2026positive

Dave discussed its Q2 earnings, raising its 2026 outlook as CashAI v6, higher ExtraCash limits, and heavier marketing drive growth, while credit losses and margins improved.

Why it matters — A DAVE watcher would care because the company cited an upgraded outlook and improved credit and margin metrics tied to its product and marketing push.

Dave Inc. (DAVE) Q2 2026 Earnings Call Transcript

Seeking Alpha · 6 Aug 2026neutral

Seeking Alpha published the transcript of Dave Inc.'s (DAVE) Q2 2026 earnings call, covering management discussion of the company's second-quarter results. The item is the full transcript of that earnings call.

Why it matters — DAVE watchers commonly review this transcript for direct commentary from management about the company's quarterly performance.

FAQ

Frequently asked questions about DAVE stock

What is the DAVE stock price forecast for 2026-2027?

The 12 Wall Street analysts covering Dave, Inc. have a median 12-month price target of $450, with estimates ranging from $310 to $490. These are third-party analyst estimates, not Ticker Nerd forecasts, and they are frequently wrong.

Is DAVE stock a buy right now?

Of the 12 analysts covering Dave, Inc., 10 rate it a Buy, 2 a Hold and 0 a Sell. Ticker Nerd's systematic factor model ranks Dave, Inc. 46 out of 100 across roughly 4,600 US stocks as at 15 Aug 2026. None of this is personal advice — it does not consider your circumstances.

How does Ticker Nerd's model rank DAVE?

As at 15 Aug 2026, Dave, Inc. ranks 46 out of 100 on Ticker Nerd's systematic factor model — a percentile across roughly 4,600 US stocks, built from its factor families. Its strongest factor family is Quality (100 of 100).

Will DAVE stock go up?

No one can know that. What the data says: the median 12-month target from 12 analysts implies +34.5% from the last close, and Ticker Nerd's factor model ranks Dave, Inc. 46 out of 100 as at 15 Aug 2026. Analyst targets are third-party estimates and frequently wrong; none of this is personal advice.

What is the DAVE stock forecast for 2030?

No analyst covering Dave, Inc. publishes a 2030 price target — Wall Street targets run 12 to 18 months out. Sites quoting a 2030 price for DAVE are extrapolating price history, which says nothing about the business. The furthest attributed numbers are the current analyst targets: $310 to $490 over the next 12 months.

How has DAVE stock performed over the past year?

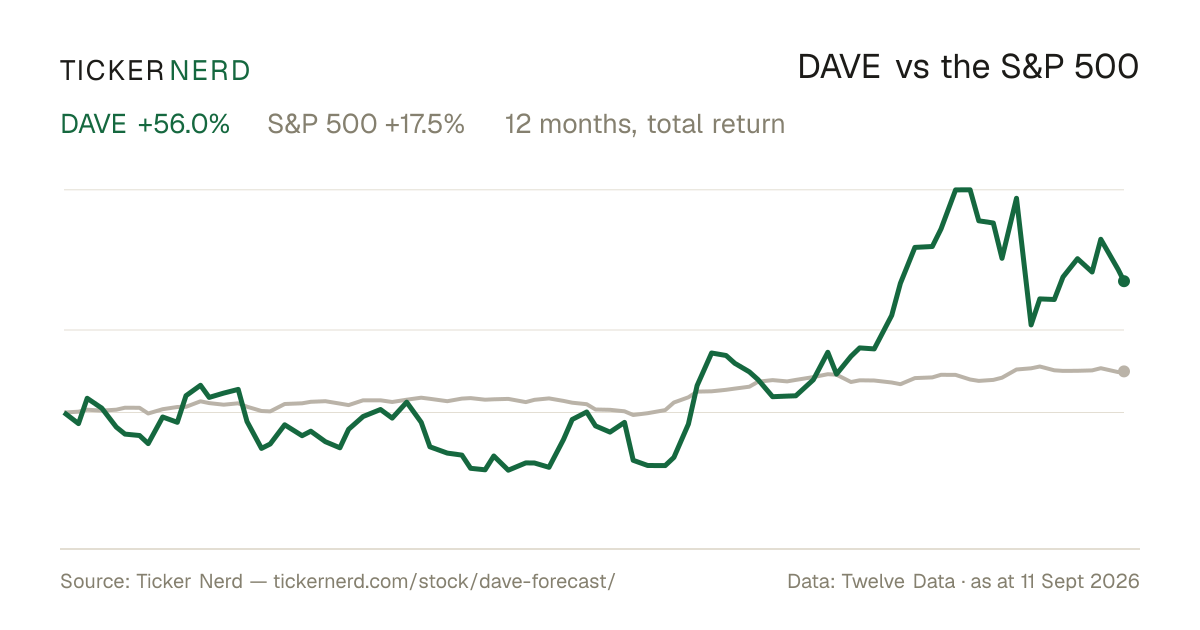
Dave, Inc. returned +66.4% over the 12 months to 14 Aug 2026, with dividends reinvested. Past performance does not indicate future returns.

What does Dave, Inc. do?

Dave Inc. Class A Common Stock represents an ownership stake in Dave Inc., a U.S.-based financial technology company and digital banking platform.

What is the latest news on DAVE?

The most recent item we track (Zacks Investment Research, 10 Aug 2026): "Should You Buy Dave Stock After Its Q2 Earnings and Recent Pullback?". Dave, Inc. reported Q2 results with revenues up 30% and EBITDA up 48%, though slowing growth triggered a pullback in the stock. Management's guidance, margins, and credit trends reportedly improved during the period.

Company

About Dave, Inc.

Dave Inc. Class A Common Stock represents an ownership stake in Dave Inc., a U.S.-based financial technology company and digital banking platform. The company focuses on serving everyday consumers, particularly those managing tight cash flow, through a mobile-first app that combines small-dollar liquidity, digital banking, and financial wellness tools. Dave Inc. today offers a suite of products including ExtraCash, a short-term cash advance service designed to help members avoid punitive overdraft fees and bridge gaps between paychecks, as well as Dave Banking, a fee-transparent digital checking account provided via a partner bank. The platform also features budgeting tools, income opportunities through its Side Hustle job-finding service, and other cash-flow management capabilities. Operating primarily in the United States and headquartered in Los Angeles, California, Dave Inc. plays a role in the consumer fintech and neobank segment, sitting between traditional banks and high-cost alternative lenders by emphasizing speed, convenience, and clearer pricing on everyday financial services.

CEO Mr. Jason Wilk · 280 employees · United States · https://dave.com